
- Home >
- Stock Photos >
- Futuristic Candlestick Chart on 3D Digital Dashboard
Futuristic Candlestick Chart on 3D Digital Dashboard Image
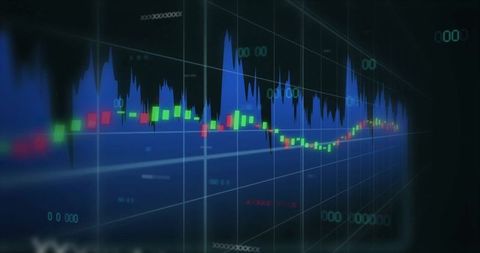
Visual depicting equipment of dynamic investment markets, showing price movements using candlestick charts overlayed on a multidimensional digital platform. Ideal for articles, presentations, or websites on financial trading, analytics, stock market strategies, or emerging investment technologies highlighting their complexities and high-tech features.
Powered by 


downloads
Tags:
More
Credit Photo
If you would like to credit the Photo, here are some ways you can do so
Text Link
photo Link
<span class="text-link">
<span>
<a target="_blank" href=https://pikwizard.com/photo/futuristic-candlestick-chart-on-3d-digital-dashboard/369ca0aebf64aacb92026883e1c69871/>PikWizard</a>
</span>
</span>
<span class="image-link">
<span
style="margin: 0 0 20px 0; display: inline-block; vertical-align: middle; width: 100%;"
>
<a
target="_blank"
href="https://pikwizard.com/photo/futuristic-candlestick-chart-on-3d-digital-dashboard/369ca0aebf64aacb92026883e1c69871/"
style="text-decoration: none; font-size: 10px; margin: 0;"
>
<img src="https://pikwizard.com/pw/medium/369ca0aebf64aacb92026883e1c69871.jpg" style="margin: 0; width: 100%;" alt="" />
<p style="font-size: 12px; margin: 0;">PikWizard</p>
</a>
</span>
</span>
Free (free of charge)
Free for personal and commercial use.
Author: Authentic Images