- Home >
- Stock Photos >
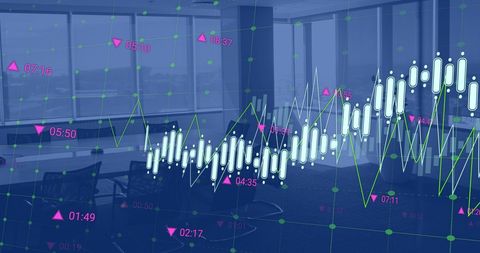
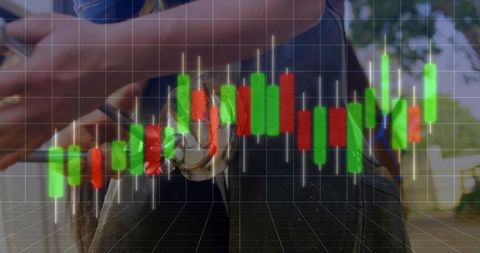
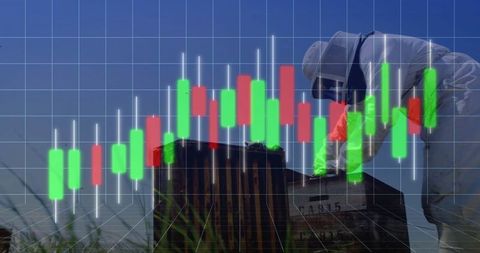
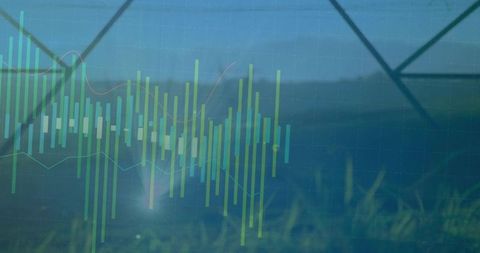
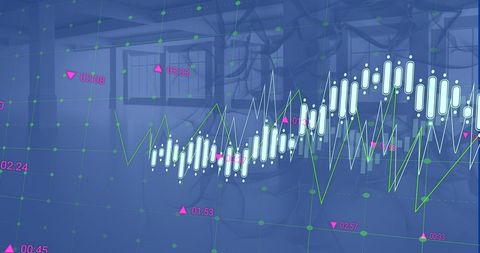
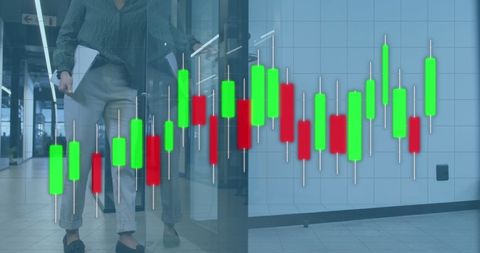
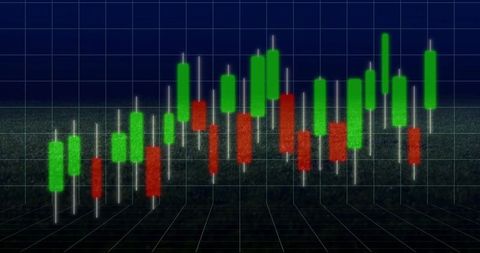
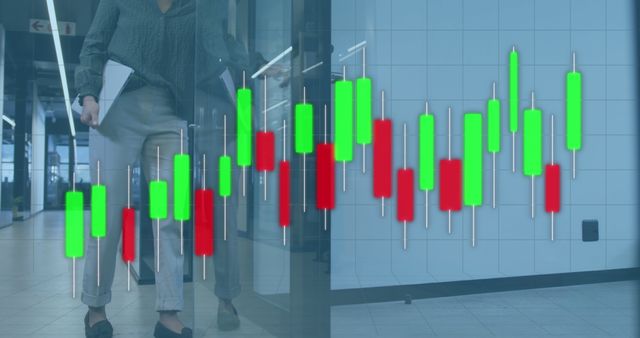
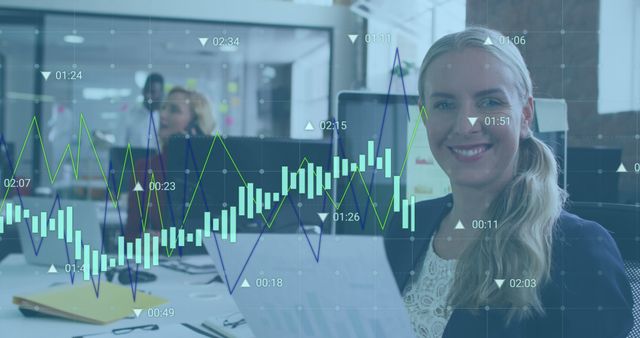
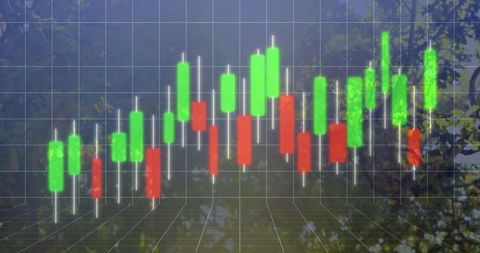
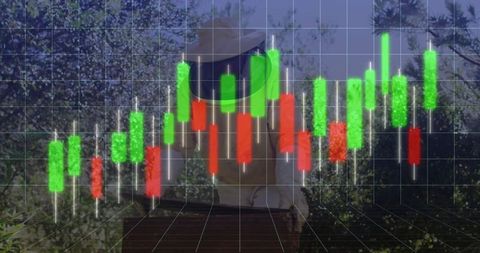
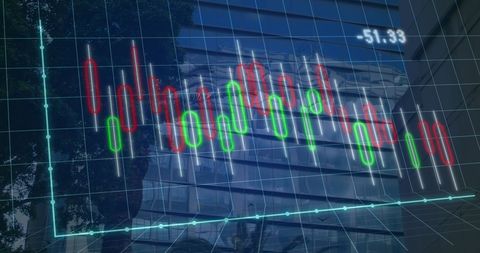
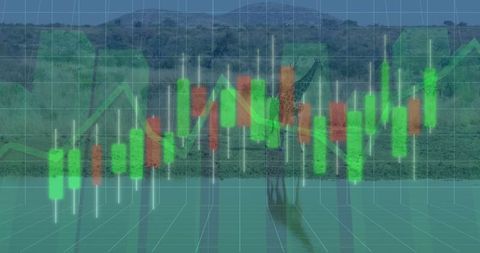
- Futuristic Candlestick Chart with Nature Background
Futuristic Candlestick Chart with Nature Background Image
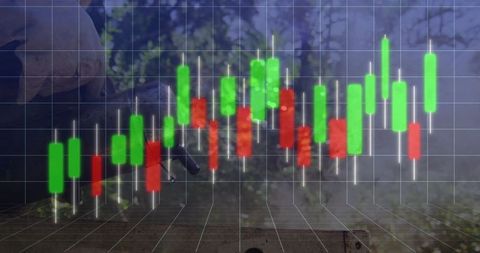
Dynamic blend of stock market candlestick chart and serene woodland background creates a captivating visual. Ideal for depicting concepts of nature meeting technology, digital innovations, finance analytics, or immersive visualization tools. Useful for websites, presentations, or articles focusing on environmental impacts on technological advancements or investment strategies involving eco-friendly technologies.

downloads
Tags:
More
Credit Photo
If you would like to credit the Photo, here are some ways you can do so
Text Link
photo Link
<span class="text-link">
<span>
<a target="_blank" href=https://pikwizard.com/photo/futuristic-candlestick-chart-with-nature-background/d2de4f84982c930c6f016d36d4b23410/>PikWizard</a>
</span>
</span>
<span class="image-link">
<span
style="margin: 0 0 20px 0; display: inline-block; vertical-align: middle; width: 100%;"
>
<a
target="_blank"
href="https://pikwizard.com/photo/futuristic-candlestick-chart-with-nature-background/d2de4f84982c930c6f016d36d4b23410/"
style="text-decoration: none; font-size: 10px; margin: 0;"
>
<img src="https://pikwizard.com/pw/medium/d2de4f84982c930c6f016d36d4b23410.jpg" style="margin: 0; width: 100%;" alt="" />
<p style="font-size: 12px; margin: 0;">PikWizard</p>
</a>
</span>
</span>
Free (free of charge)
Free for personal and commercial use.
Author: Creative Art