- Home >
- Stock Photos >
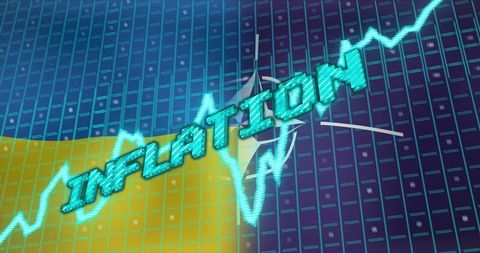
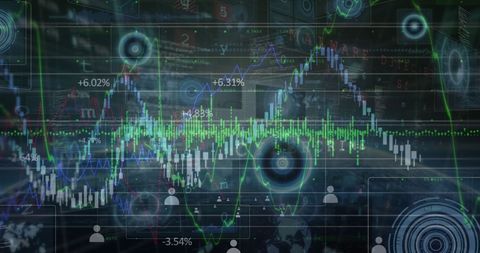
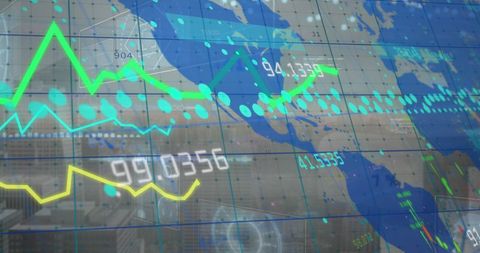
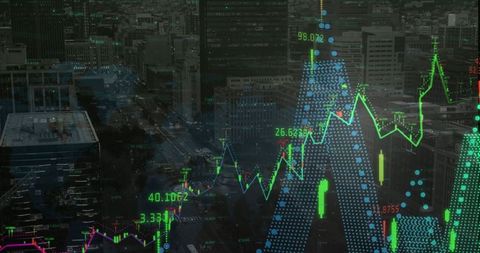
- Futuristic Climate Risk Visualization with Data and Icons
Futuristic Climate Risk Visualization with Data and Icons Image

This visual combines elements of technology, data visualization, and climate-related icons. The glowing turquoise letters indicate themes of awareness and urgency around environmental issues, represented over a backdrop of code and technological symbols. Ideal for use in presentations on sustainability projects, educational materials, or articles centered on technological innovation addressing climate change.

downloads
Tags:
More
Credit Photo
If you would like to credit the Photo, here are some ways you can do so
Text Link
photo Link
<span class="text-link">
<span>
<a target="_blank" href=https://pikwizard.com/photo/futuristic-climate-risk-visualization-with-data-and-icons/518926a7e8cebd9dc0028da1a28ad73a/>PikWizard</a>
</span>
</span>
<span class="image-link">
<span
style="margin: 0 0 20px 0; display: inline-block; vertical-align: middle; width: 100%;"
>
<a
target="_blank"
href="https://pikwizard.com/photo/futuristic-climate-risk-visualization-with-data-and-icons/518926a7e8cebd9dc0028da1a28ad73a/"
style="text-decoration: none; font-size: 10px; margin: 0;"
>
<img src="https://pikwizard.com/pw/medium/518926a7e8cebd9dc0028da1a28ad73a.jpg" style="margin: 0; width: 100%;" alt="" />
<p style="font-size: 12px; margin: 0;">PikWizard</p>
</a>
</span>
</span>
Free (free of charge)
Free for personal and commercial use.
Author: Authentic Images