
- Home >
- Stock Photos >
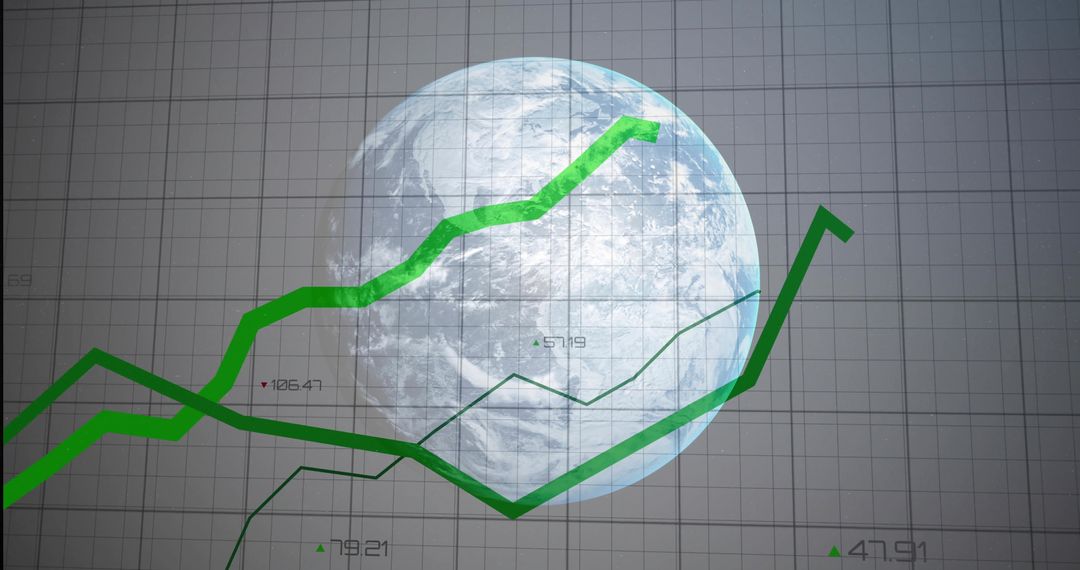
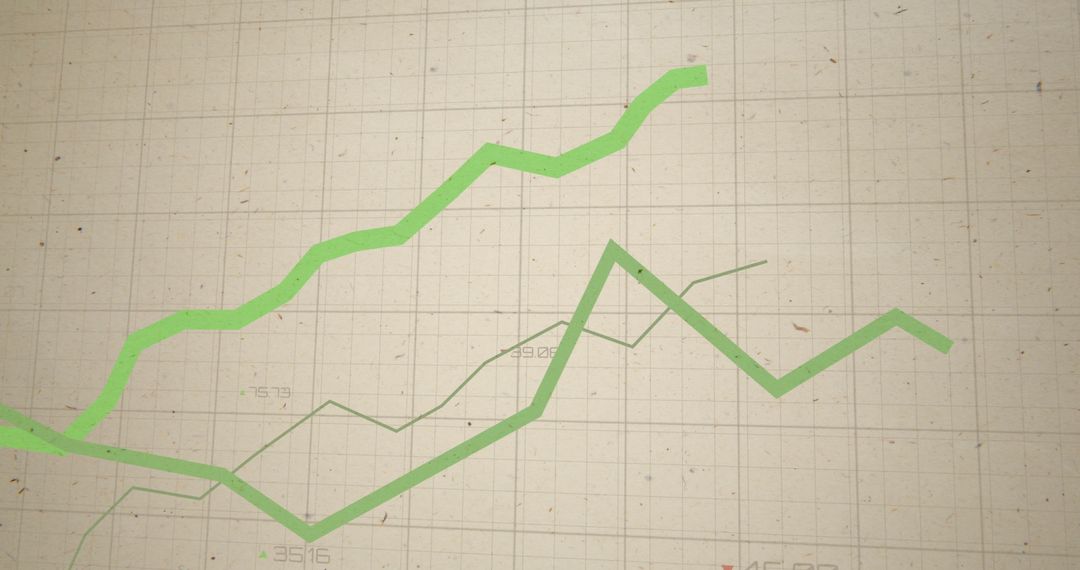
- Futuristic Cryptocurrency Market Chart with Green Line Progression
Futuristic Cryptocurrency Market Chart with Green Line Progression Image

Vibrant depiction of a cryptocurrency market chart with green lines showing growth and data points over geometrical designs. Suitable for illustrating concepts related to finance, economic trends, digital currency, and investment strategies. Ideal for use in financial reports, articles on market analysis, and business presentations.
Powered by  - Get 15% off with code: PIKWIZARD15


0
downloads
downloads
Tags:
More
Credit Photo
If you would like to credit the Photo, here are some ways you can do so
Text Link
photo Link
<span class="text-link">
<span>
<a target="_blank" href=https://pikwizard.com/photo/futuristic-cryptocurrency-market-chart-with-green-line-progression/f587f6b749094cfe4ae0407383496e60/>PikWizard</a>
</span>
</span>
<span class="image-link">
<span
style="margin: 0 0 20px 0; display: inline-block; vertical-align: middle; width: 100%;"
>
<a
target="_blank"
href="https://pikwizard.com/photo/futuristic-cryptocurrency-market-chart-with-green-line-progression/f587f6b749094cfe4ae0407383496e60/"
style="text-decoration: none; font-size: 10px; margin: 0;"
>
<img src="https://pikwizard.com/pw/medium/f587f6b749094cfe4ae0407383496e60.jpg" style="margin: 0; width: 100%;" alt="" />
<p style="font-size: 12px; margin: 0;">PikWizard</p>
</a>
</span>
</span>
Free (free of charge)
Free for personal and commercial use.
Author: Creative Art
Similar Free Stock Images

Premium


Premium


Premium


Premium


Premium


Premium


Premium


Premium


Premium


Premium


Premium


Premium


Premium


Premium


Premium


Premium


Premium


Premium


Premium


Premium


Premium


Premium


Premium


Premium

