
- Home >
- Stock Photos >
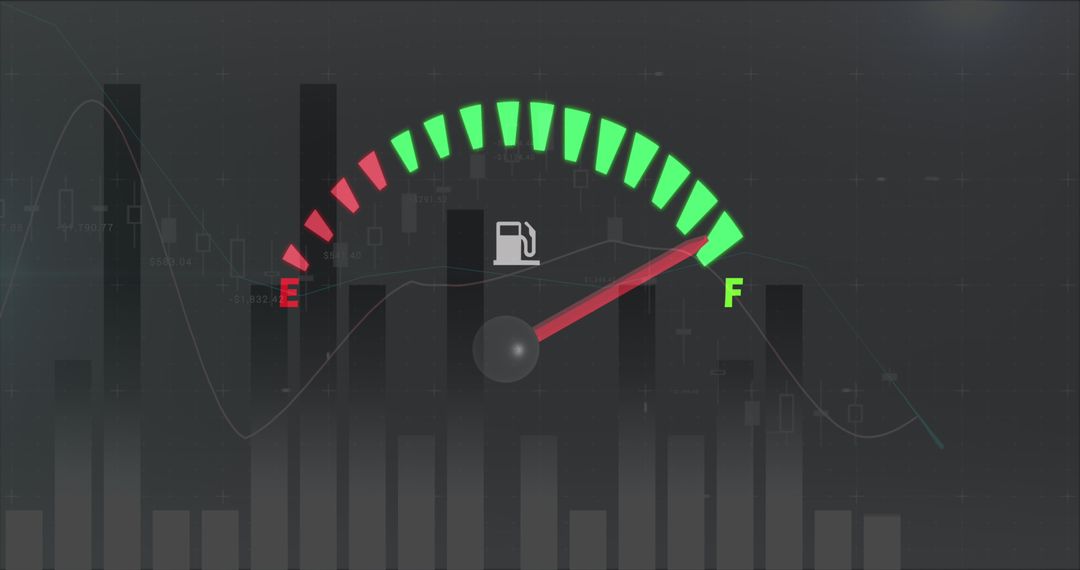
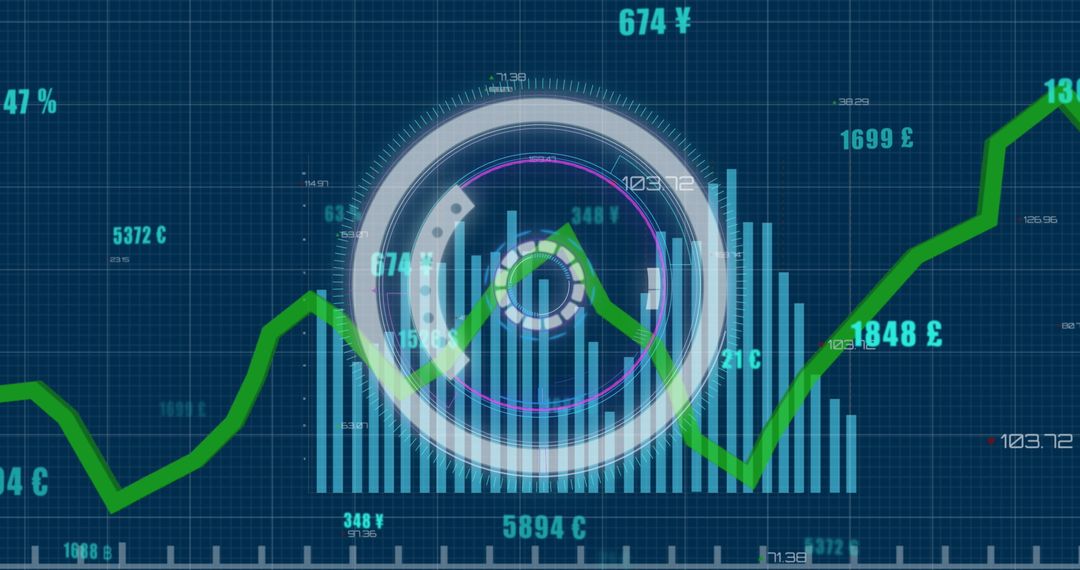
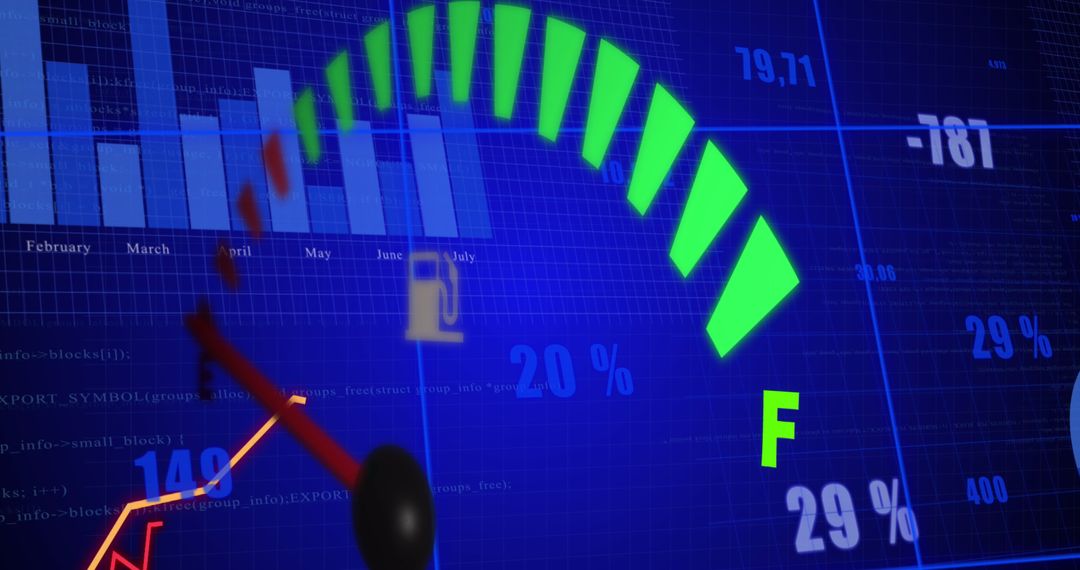
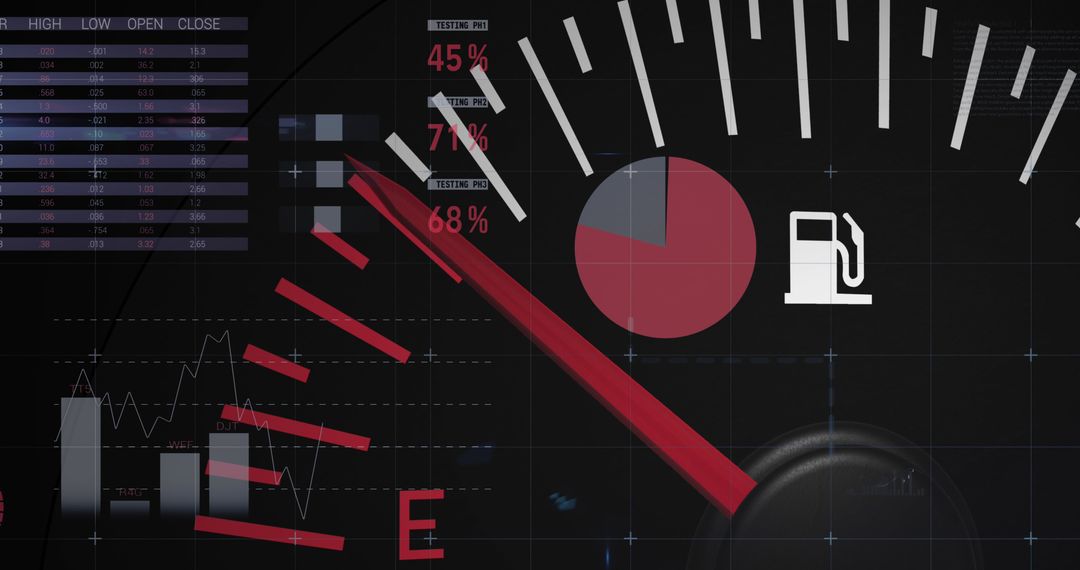
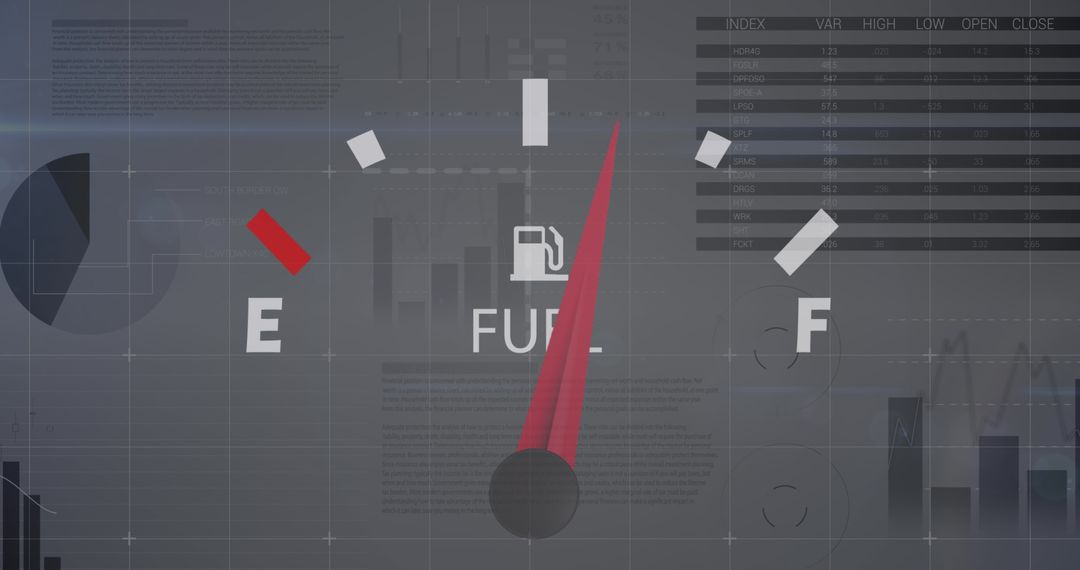
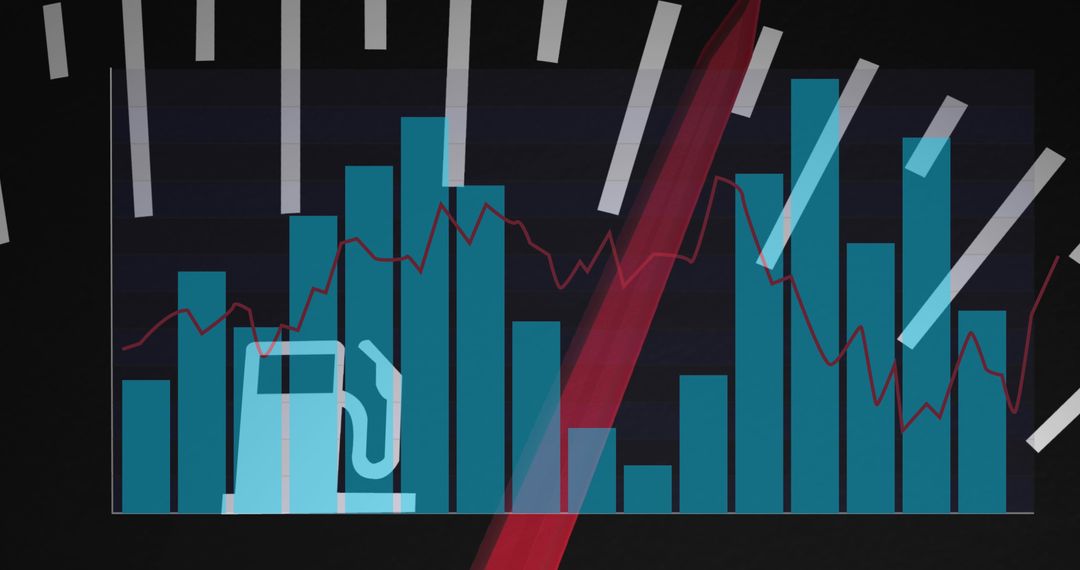
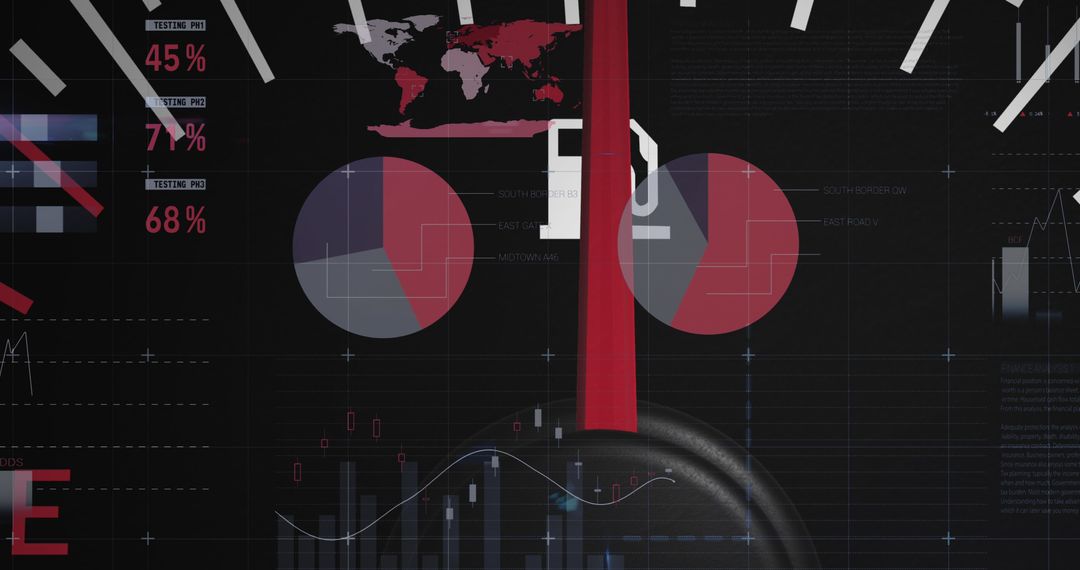
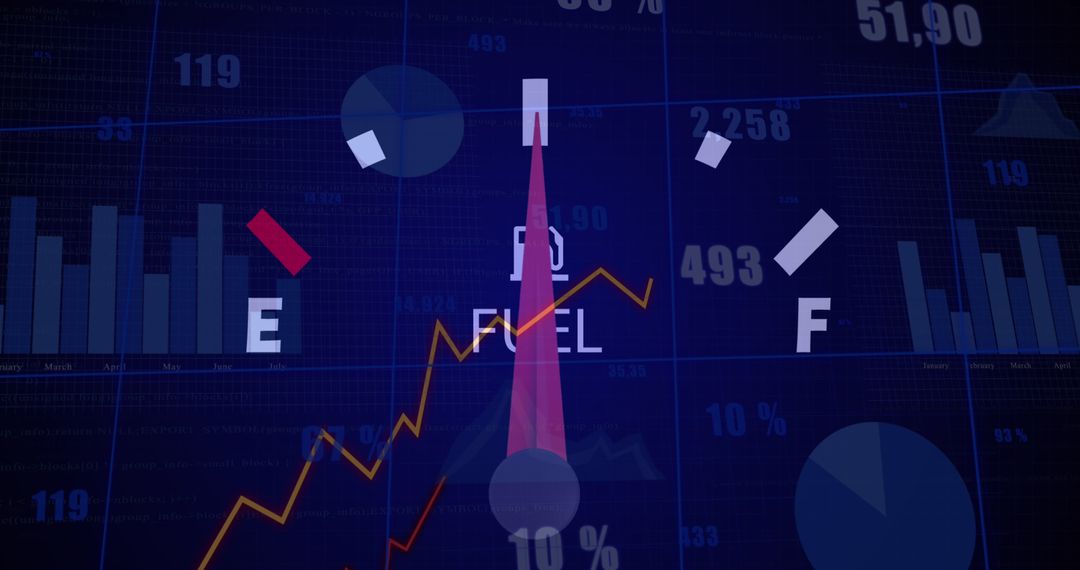
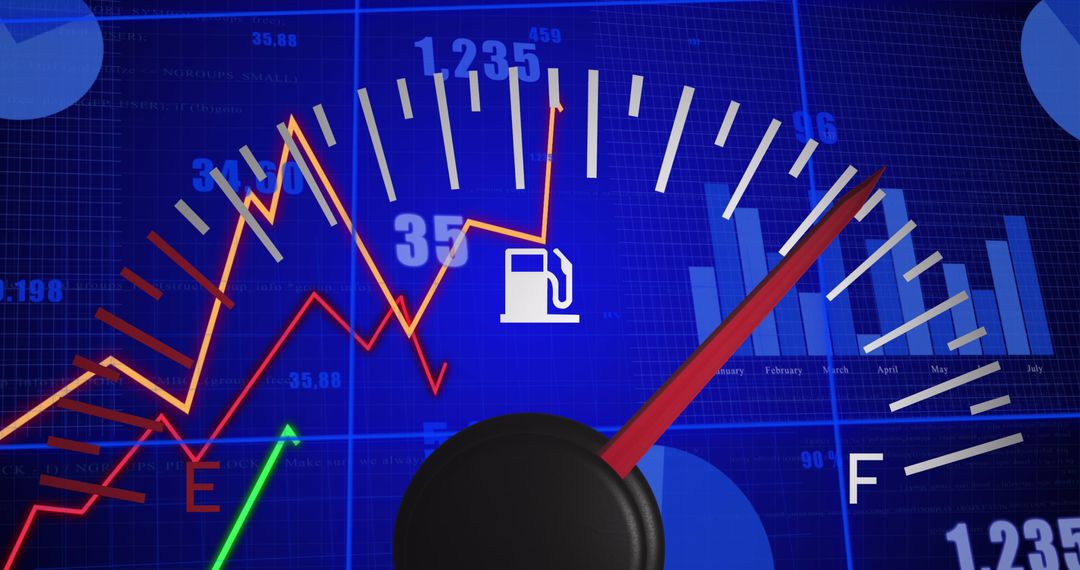
- Futuristic Dashboard Display with Economic Graphs
Futuristic Dashboard Display with Economic Graphs Image

Complex and dynamic visualization showcasing futuristic dashboard elements intertwined with economic data, graphs, and charts. Illustrates concepts such as economic trends and data analytics. Useful for presentations, reports, articles on financial markets, data analysis technology, and global business developments.
Powered by  - Get 15% off with code: PIKWIZARD15


0
downloads
downloads
Tags:
More
Credit Photo
If you would like to credit the Photo, here are some ways you can do so
Text Link
photo Link
<span class="text-link">
<span>
<a target="_blank" href=https://pikwizard.com/photo/futuristic-dashboard-display-with-economic-graphs/ab8dd45ef250730ed70a85435aa4aa13/>PikWizard</a>
</span>
</span>
<span class="image-link">
<span
style="margin: 0 0 20px 0; display: inline-block; vertical-align: middle; width: 100%;"
>
<a
target="_blank"
href="https://pikwizard.com/photo/futuristic-dashboard-display-with-economic-graphs/ab8dd45ef250730ed70a85435aa4aa13/"
style="text-decoration: none; font-size: 10px; margin: 0;"
>
<img src="https://pikwizard.com/pw/medium/ab8dd45ef250730ed70a85435aa4aa13.jpg" style="margin: 0; width: 100%;" alt="" />
<p style="font-size: 12px; margin: 0;">PikWizard</p>
</a>
</span>
</span>
Free (free of charge)
Free for personal and commercial use.
Author: People Creations
Similar Free Stock Images

Premium


Premium


Premium


Premium


Premium


Premium


Premium


Premium


Premium


Premium


Premium


Premium


Premium


Premium


Premium


Premium


Premium


Premium


Premium


Premium

Premium


Premium


Premium


Premium

