- Home >
- Stock Photos >
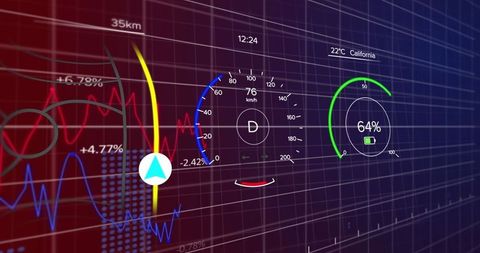
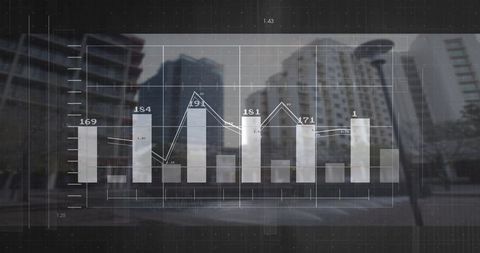
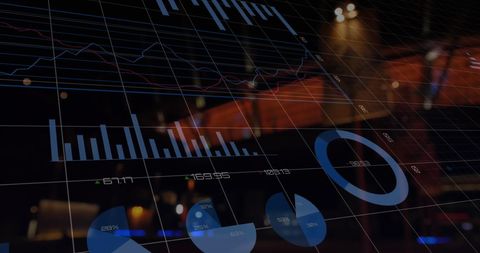
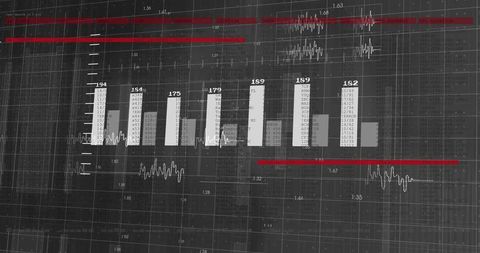
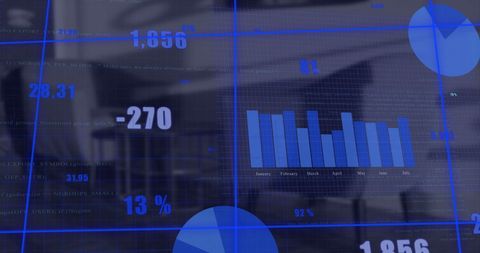
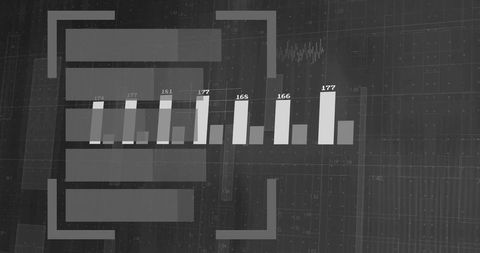
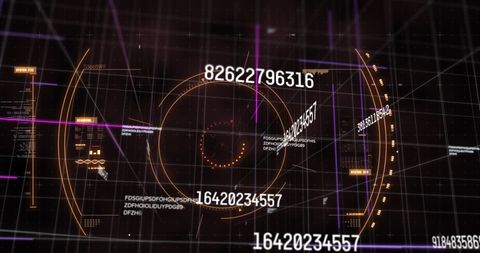
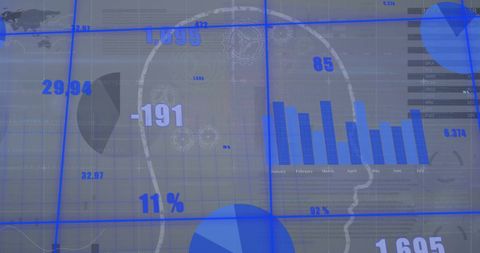
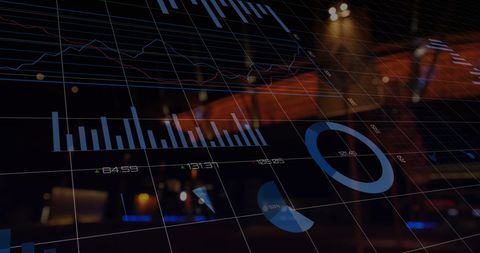
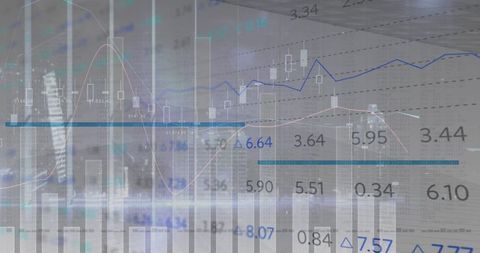
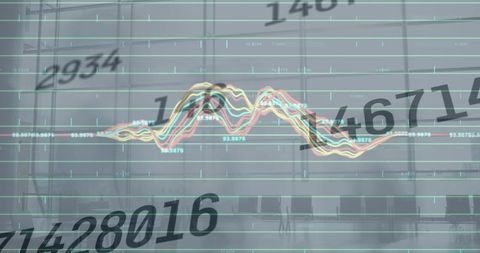
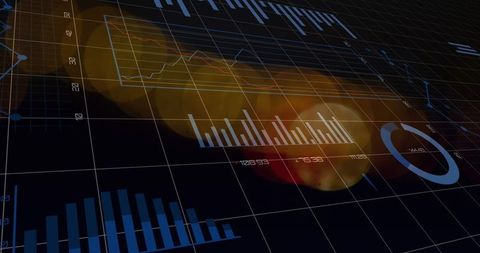
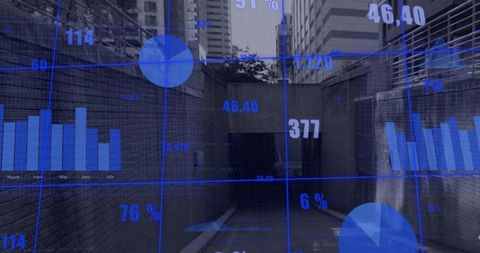
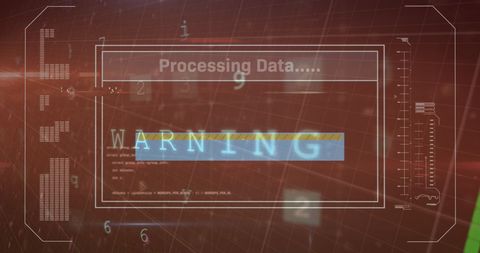
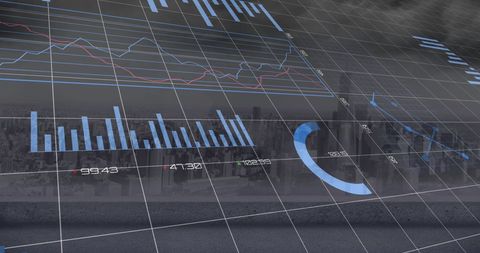
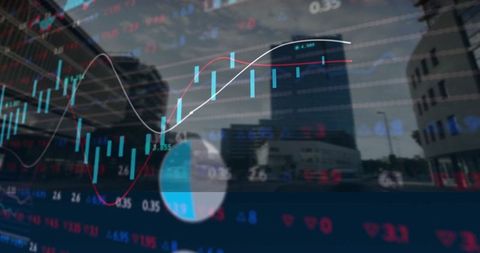
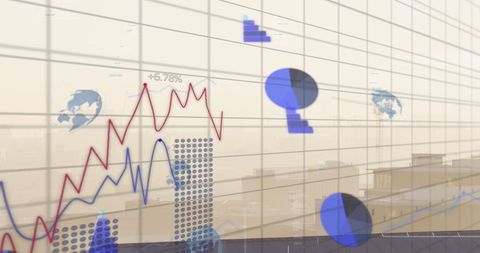
- Futuristic Dashboard Interface with Speed Gauges and Analytics
Futuristic Dashboard Interface with Speed Gauges and Analytics Image
This digital interface displays advanced analytics through a blend of bar charts, speed gauges, and circular gauges. The visualization provides insights into performance metrics typical for tech applications and innovations. Ideal for illustrating concepts in data analysis, technology development, business presentations, or UI design brainstorming.

downloads
Tags:
More
Credit Photo
If you would like to credit the Photo, here are some ways you can do so
Text Link
photo Link
<span class="text-link">
<span>
<a target="_blank" href=https://pikwizard.com/photo/futuristic-dashboard-interface-with-speed-gauges-and-analytics/e4242aa94db2cd1637a4ad561588712c/>PikWizard</a>
</span>
</span>
<span class="image-link">
<span
style="margin: 0 0 20px 0; display: inline-block; vertical-align: middle; width: 100%;"
>
<a
target="_blank"
href="https://pikwizard.com/photo/futuristic-dashboard-interface-with-speed-gauges-and-analytics/e4242aa94db2cd1637a4ad561588712c/"
style="text-decoration: none; font-size: 10px; margin: 0;"
>
<img src="https://pikwizard.com/pw/medium/e4242aa94db2cd1637a4ad561588712c.jpg" style="margin: 0; width: 100%;" alt="" />
<p style="font-size: 12px; margin: 0;">PikWizard</p>
</a>
</span>
</span>
Free (free of charge)
Free for personal and commercial use.
Author: People Creations