- Home >
- Stock Photos >
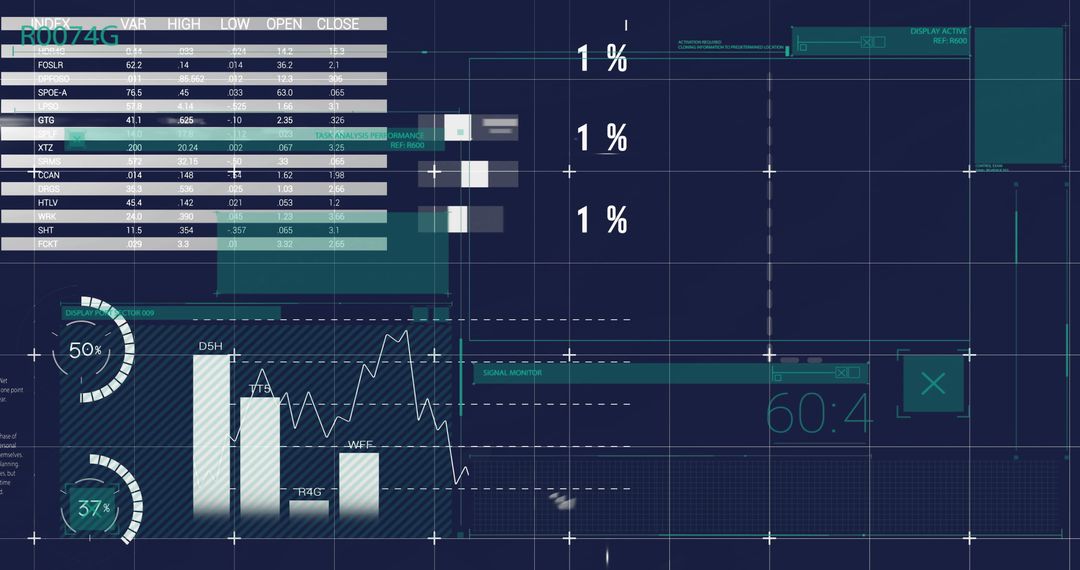
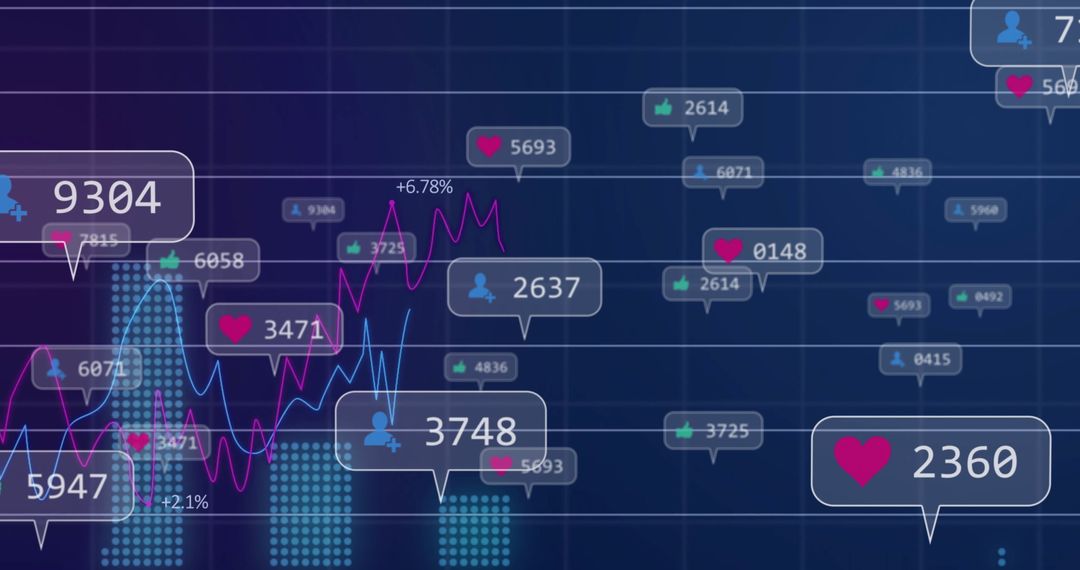
- Futuristic Dashboard with Analytics and Social Metrics
Futuristic Dashboard with Analytics and Social Metrics Image
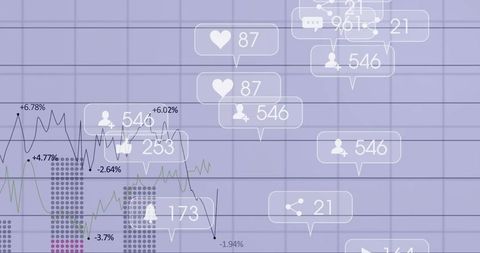
Digital interface featuring a mix of line and bar charts, enriched with social media metrics such as likes, shares, and profile interactions. Useful for presentations on business analytics, statistics tutorials, social media strategy sessions, or technological overviews in digital marketing.
Powered by  - Get 15% off with code: PIKWIZARD15


0
downloads
downloads
Tags:
More
Credit Photo
If you would like to credit the Photo, here are some ways you can do so
Text Link
photo Link
<span class="text-link">
<span>
<a target="_blank" href=https://pikwizard.com/photo/futuristic-dashboard-with-analytics-and-social-metrics/573609f23a827542a829fb9a1dc26ad2/>PikWizard</a>
</span>
</span>
<span class="image-link">
<span
style="margin: 0 0 20px 0; display: inline-block; vertical-align: middle; width: 100%;"
>
<a
target="_blank"
href="https://pikwizard.com/photo/futuristic-dashboard-with-analytics-and-social-metrics/573609f23a827542a829fb9a1dc26ad2/"
style="text-decoration: none; font-size: 10px; margin: 0;"
>
<img src="https://pikwizard.com/pw/medium/573609f23a827542a829fb9a1dc26ad2.jpg" style="margin: 0; width: 100%;" alt="" />
<p style="font-size: 12px; margin: 0;">PikWizard</p>
</a>
</span>
</span>
Free (free of charge)
Free for personal and commercial use.
Author: Authentic Images
Similar Free Stock Images

Premium


Premium


Premium


Premium


Premium


Premium


Premium


Premium


Premium


Premium


Premium


Premium


Premium


Premium


Premium


Premium


Premium


Premium


Premium


Premium


Premium


Premium


Premium


Premium