
- Home >
- Stock Photos >
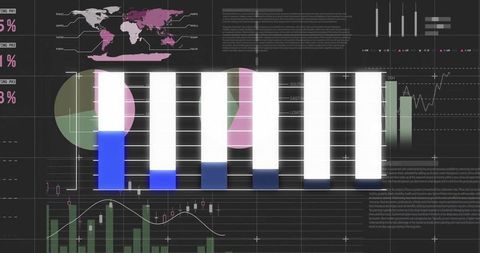
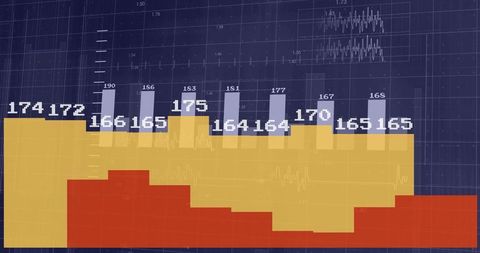
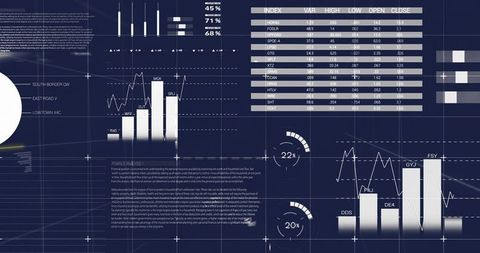
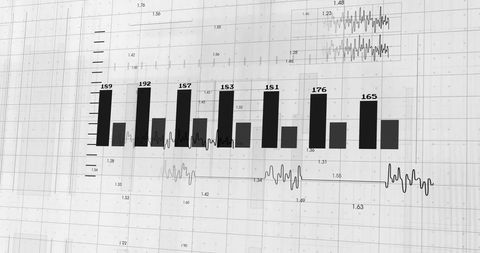
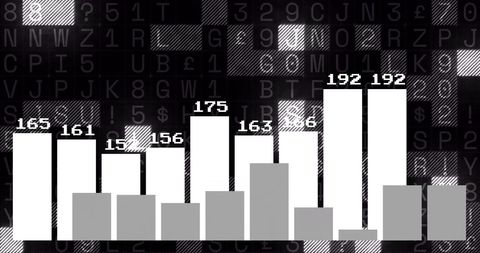
- Futuristic Dashboard with Bar Graph and Line Chart Elements
Futuristic Dashboard with Bar Graph and Line Chart Elements Image
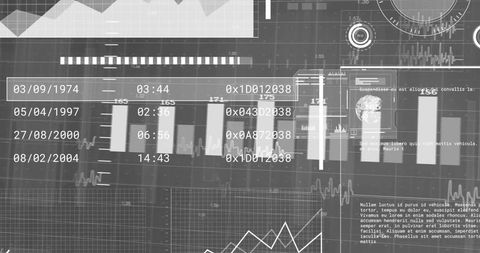
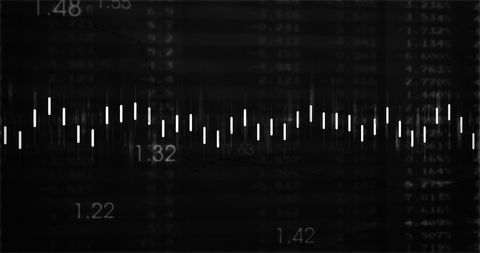
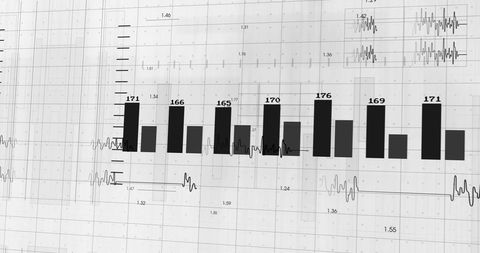
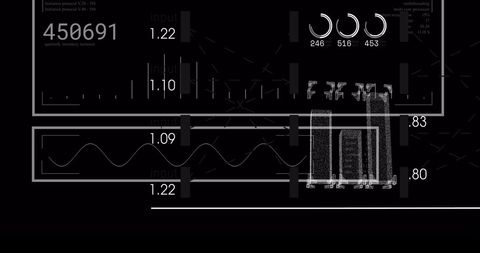
This design of a futuristic analytics dashboard features bar charts and line graphs on a digital grid, making it an ideal choice for presentations or marketing materials focused on showcasing data analysis tools, technology services, or IT growth strategies. Perfect for illustrating concepts in high-tech studies, digital interfaces, and interactive workspace environments.
Powered by  - Get 15% off with code: PIKWIZARD15


downloads
Tags:
More
Credit Photo
If you would like to credit the Photo, here are some ways you can do so
Text Link
photo Link
<span class="text-link">
<span>
<a target="_blank" href=https://pikwizard.com/photo/futuristic-dashboard-with-bar-graph-and-line-chart-elements/4949273d5cb6f78300cbf9dd11edf2b8/>PikWizard</a>
</span>
</span>
<span class="image-link">
<span
style="margin: 0 0 20px 0; display: inline-block; vertical-align: middle; width: 100%;"
>
<a
target="_blank"
href="https://pikwizard.com/photo/futuristic-dashboard-with-bar-graph-and-line-chart-elements/4949273d5cb6f78300cbf9dd11edf2b8/"
style="text-decoration: none; font-size: 10px; margin: 0;"
>
<img src="https://pikwizard.com/pw/medium/4949273d5cb6f78300cbf9dd11edf2b8.jpg" style="margin: 0; width: 100%;" alt="" />
<p style="font-size: 12px; margin: 0;">PikWizard</p>
</a>
</span>
</span>
Free (free of charge)
Free for personal and commercial use.
Author: Authentic Images
Similar Free Stock Images

Premium

Premium

Premium


Premium


Premium


Premium


Premium

Premium

Premium


Premium


Premium


Premium


Premium


Premium


Premium

Premium


Premium


Premium

Premium


Premium


Premium


Premium


Premium


Premium

Premium


Explore More Free Stock Images