
- Home >
- Stock Photos >
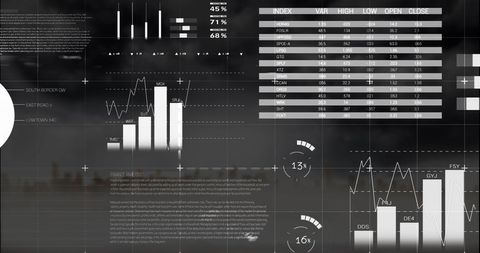
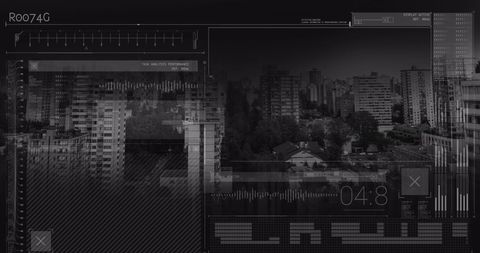
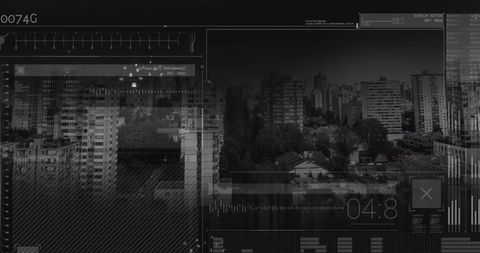
- Futuristic Dashboard with Code and Analytics
Futuristic Dashboard with Code and Analytics Image

Visual depicting digital dashboard interface featuring line graph and code fragments overlaying silhouette with headphones. Represents themes of technology advancement, data analysis, and connectivity. Useful for illustrating concepts in software development, computer programming, or modern technological solutions in presentations or marketing materials.
Powered by 


downloads
Tags:
More
Credit Photo
If you would like to credit the Photo, here are some ways you can do so
Text Link
photo Link
<span class="text-link">
<span>
<a target="_blank" href=https://pikwizard.com/photo/futuristic-dashboard-with-code-and-analytics/91efab74da1ab89988674dda8d43011b/>PikWizard</a>
</span>
</span>
<span class="image-link">
<span
style="margin: 0 0 20px 0; display: inline-block; vertical-align: middle; width: 100%;"
>
<a
target="_blank"
href="https://pikwizard.com/photo/futuristic-dashboard-with-code-and-analytics/91efab74da1ab89988674dda8d43011b/"
style="text-decoration: none; font-size: 10px; margin: 0;"
>
<img src="https://pikwizard.com/pw/medium/91efab74da1ab89988674dda8d43011b.jpg" style="margin: 0; width: 100%;" alt="" />
<p style="font-size: 12px; margin: 0;">PikWizard</p>
</a>
</span>
</span>
Free (free of charge)
Free for personal and commercial use.
Author: Authentic Images
Similar Free Stock Images

Premium


Premium


Premium


Premium


Premium

Premium


Premium


Premium


Premium


Premium


Premium


Premium


Premium

Premium


Premium


Premium


Premium

Premium


Premium


Premium


Premium


Premium


Premium


Premium

Premium


Explore More Free Stock Images