
- Home >
- Stock Photos >
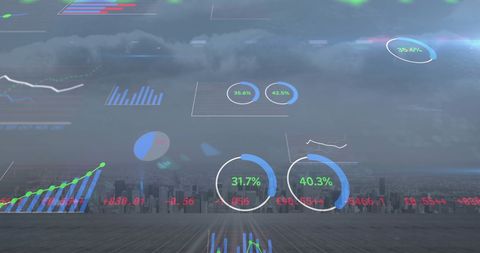
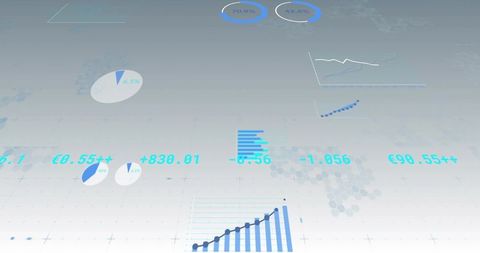
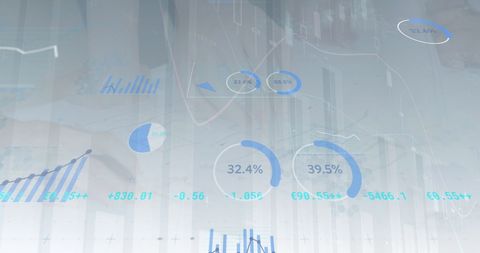
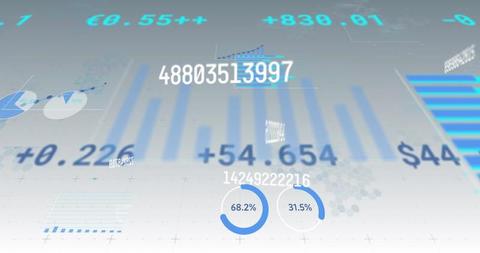
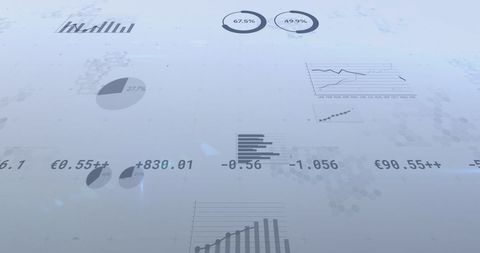
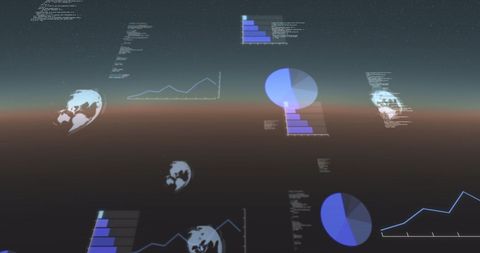
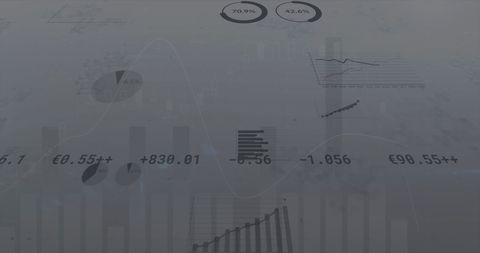
- Futuristic Dashboard with Global Metrics and Data Visualization
Futuristic Dashboard with Global Metrics and Data Visualization Image
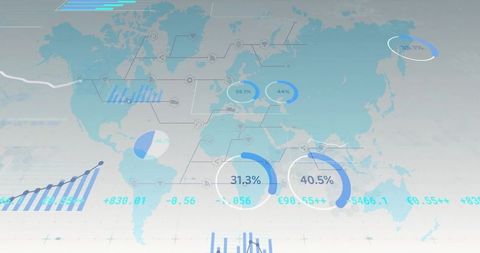
Digital display features a world map with circular progress indicators and various charts, offering a dynamic view of analytics. Bright blue accents highlight key metrics, suggesting business performance, geographical statistics, or technological growth trends. Useful for presentations on data-centric topics, global business strategy sessions, or marketing materials showcasing innovative technological solutions.
Powered by  - Get 15% off with code: PIKWIZARD15


downloads
Tags:
More
Credit Photo
If you would like to credit the Photo, here are some ways you can do so
Text Link
photo Link
<span class="text-link">
<span>
<a target="_blank" href=https://pikwizard.com/photo/futuristic-dashboard-with-global-metrics-and-data-visualization/54ff11da6ed4b204592325465db80b9d/>PikWizard</a>
</span>
</span>
<span class="image-link">
<span
style="margin: 0 0 20px 0; display: inline-block; vertical-align: middle; width: 100%;"
>
<a
target="_blank"
href="https://pikwizard.com/photo/futuristic-dashboard-with-global-metrics-and-data-visualization/54ff11da6ed4b204592325465db80b9d/"
style="text-decoration: none; font-size: 10px; margin: 0;"
>
<img src="https://pikwizard.com/pw/medium/54ff11da6ed4b204592325465db80b9d.jpg" style="margin: 0; width: 100%;" alt="" />
<p style="font-size: 12px; margin: 0;">PikWizard</p>
</a>
</span>
</span>
Free (free of charge)
Free for personal and commercial use.
Author: Authentic Images
Similar Free Stock Images
Premium


Premium


Premium


Premium

Premium

Premium


Premium


Premium


Premium


Premium


Premium


Premium

Premium

Premium


Premium


Premium


Premium


Premium

Premium


Premium

Premium


Premium


Premium

Premium

Premium


Explore More Free Stock Images