- Home >
- Stock Photos >
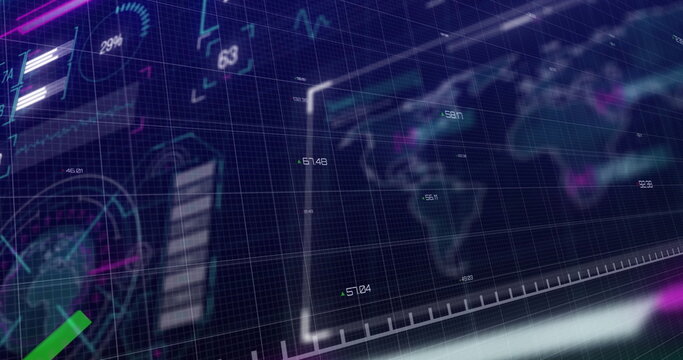
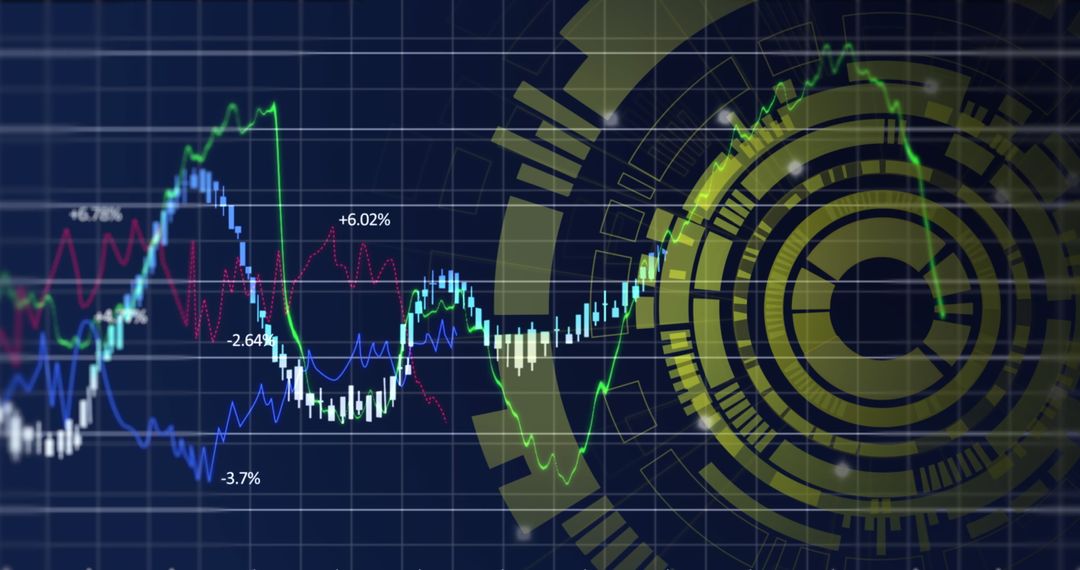
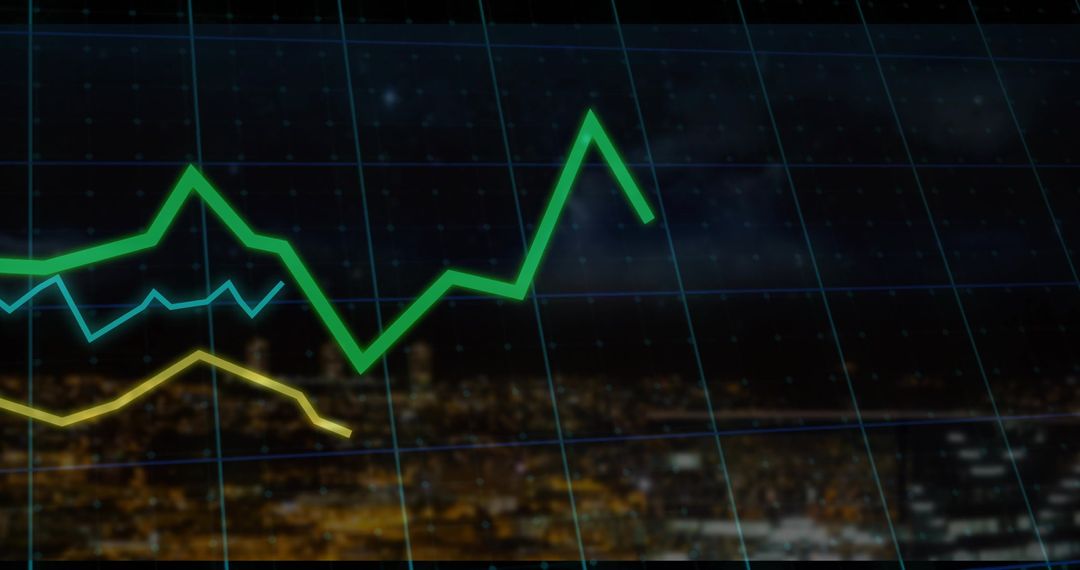
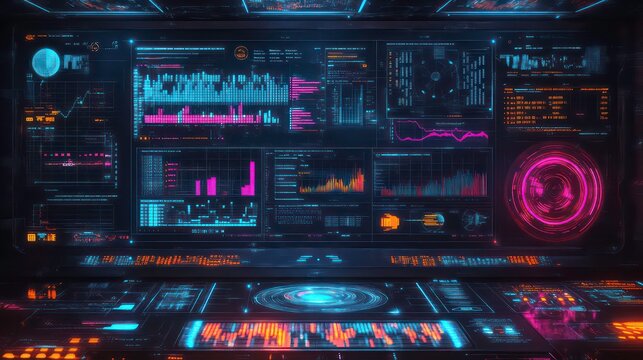
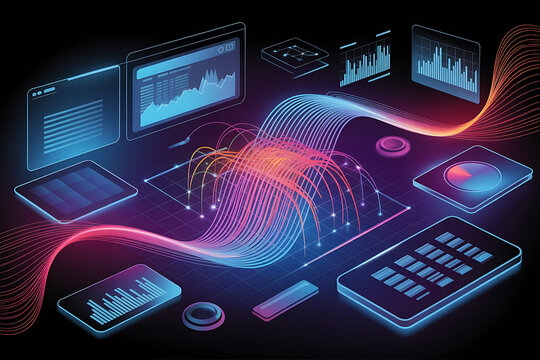
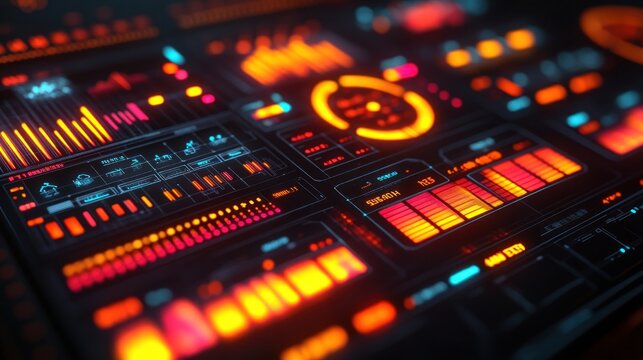
- Futuristic Dashboard with Neon Line Graphs and Digital Interface
Futuristic Dashboard with Neon Line Graphs and Digital Interface Image

This image portrays a high-tech dashboard showing various data visualizations including neon line graphs, circular gauges, and bar charts. Ideal for use in presentations, reports on emerging technologies, finance, and UI/UX design projects. The intricate combination of modern graphics evokes themes of innovation and advanced data analytics, providing a relevant backdrop for illustrating technological developments in industries driven by data.
Powered by 


0
downloads
downloads
Tags:
More
Credit Photo
If you would like to credit the Photo, here are some ways you can do so
Text Link
photo Link
<span class="text-link">
<span>
<a target="_blank" href=https://pikwizard.com/photo/futuristic-dashboard-with-neon-line-graphs-and-digital-interface/403524f67766e3514f78dfd7e602af63/>PikWizard</a>
</span>
</span>
<span class="image-link">
<span
style="margin: 0 0 20px 0; display: inline-block; vertical-align: middle; width: 100%;"
>
<a
target="_blank"
href="https://pikwizard.com/photo/futuristic-dashboard-with-neon-line-graphs-and-digital-interface/403524f67766e3514f78dfd7e602af63/"
style="text-decoration: none; font-size: 10px; margin: 0;"
>
<img src="https://pikwizard.com/pw/medium/403524f67766e3514f78dfd7e602af63.jpg" style="margin: 0; width: 100%;" alt="" />
<p style="font-size: 12px; margin: 0;">PikWizard</p>
</a>
</span>
</span>
Free (free of charge)
Free for personal and commercial use.
Author: Awesome Content
Similar Free Stock Images

Premium


Premium


Premium


Premium


Premium


Premium


Premium


Premium


Premium


Premium


Premium


Premium


Premium


Premium


Premium


Premium


Premium


Premium


Premium


Premium


Premium


Premium


Premium


Premium