1. Home > 
  2. Stock Photos > 
  3. Futuristic Data Analysis and Digital Interface Over Cityscape

Futuristic Data Analysis and Digital Interface Over Cityscape Image

Futuristic Data Analysis and Digital Interface Over Cityscape

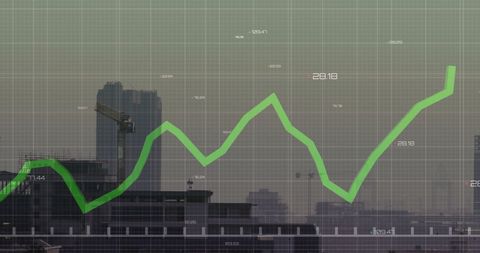
This conceptual image combines a graph overlay with a city skyline, illustrating the integration of data analysis and urban environment. Ideal for use in articles or presentations about modern technology, business forecasting, economic trends, or urban development. Suitable for digital transformations or smart city solutions marketing materials.

Powered by Shutterstock logo - Get 15% off with code: PIKWIZARD15
Business data analytics and intelligence dashboard concept, businessman using futuristic holographic graphs and charts on laptop, big data analysis, KPIs, statistics, digital transformation. - Powered by Shutterstock - Get 15% off with code: PIKWIZARD15A Black Man Interacts With a Sophisticated Digital Realm, Engaging With Dynamic 3d Infographics and Equations, Highlighting the Fusion of Technology, Ai, and Statistical Analysis - Powered by Shutterstock - Get 15% off with code: PIKWIZARD15Hands typing on laptop with digital analytics dashboard, charts, and graphs overlayed, on bright background. Concept of data and business analysis - Powered by Shutterstock - Get 15% off with code: PIKWIZARD15Data flow from database and cloud to processing and analytics dashboards, representing data analysis, automation, insight generation, and digital intelligence Latch - Powered by Shutterstock - Get 15% off with code: PIKWIZARD15AI Using. Silhouetted analysts interact with a large AI data. AI Display charts graphs and analytics. Business team using futuristic AI interface visuals data. Technology with biz insight and big data - Powered by Shutterstock - Get 15% off with code: PIKWIZARD15

Credit Photo

If you would like to credit the Photo, here are some ways you can do so

Free (free of charge)

Free for personal and commercial use.

Author: Authentic Images

Similar Free Stock Images

Social Media Activity Icons on Digital Graph
Premium
KPI data analytics concept, Key performance indicator analysis system. Information technology digital software management. Visualization tech solution. Business artificial intelligence. AI dashboard.
Digital Financial Data on Server with Stock Market Graph
Premium
Professionals collaborate on environmental social governance green business sustainability strategies for net zero carbon reduction. They analyze data and plan eco friendly corporate solutions.
Premium
A professional person analyzes financial growth and business data on a digital screen. Perfect for data science, market research, analytics dashboards, and corporate performance monitoring concepts.
Digital Data Trends Over High-Tech Server Room
Diverse Team Analyzing Growth Data in Collaborative Office Meeting
Analytics Graph Overlay on Modern Data Center
Premium
Businessman analyzing financial data using a digital tablet and holographic charts.
Gamepad Icon Overlaid on Financial Data Chart
Financial Graph Displayed Over City Skyline at Sunset
Digital Graph with Rising and Falling Lines on Grid Background
Financial Data Analysis with Team Collaboration in Office
Global Financial Data Trends Over Electric Grid
Digital Concept of Stagflation with Chart and Globe Illustration
Digital Data Analytics Overlay on Cityscape
Energy Market Analysis Over Electrical Grid Background
Premium
Showing chart with candlestick bars, line graph, labels on screen, hex grid overlay, diagonal bars. Technology, finance, analytics, data, dashboard, visualization, digital
Green Line Graph with Data Points on Grid Background
Green Line Graph Overlapping Data Server Racks in Technology Center
Abstract Digital Graph and Code on Violet Background
Data Trends and Analysis on 3D Digital Grid
Rising Stock Market Graph on Blue Financial Background
Dynamic Financial Graphs Overlaying Urban Skyline
Digital Financial Data Overlaying City Skyline at Dusk
Financial Market Growth Over City Skyline
Business Women Analyzing Data in Office with Growth Chart Overlay
Digital Graph Displaying Dynamic Data Analysis
Line Graph Illustrating Data Trend on Green Digital Background
Abstract Representation of Financial Data Processing
Abstract Graphs Over Modern Building at Night
Dynamic Business Data and Cityscape Visualization
Financial Growth Statistic Data Processing Over Urban Cityscape
Digital Financial Data with Graph and Grid Patterns
Digital Financial Data Overlaying Skyline of Modern City
Digital Graph Display with Dynamic Flux on Purple Background
Interactive Social Media Metrics Overlaid on Business Data Graph
Premium
Target and business strategy planning with teamwork and leadership in planning, project management, data analysis and marketing performance to goal setting in business strategy.
Business Team Analyzing Financial Downtrend Data in Modern Office
Abstract Financial Growth Visualization with City Background
Premium
Business graphs, hands and discussion with tablet screen for data analysis, revenue performance or profit growth. Closeup, investors or statistics for budget forecasting, financial feedback or report
Financial Data Overlay on Cityscape Visualizing Market Trends
Business Colleagues Analyzing Financial Graph in Office Meeting
Futuristic Digital Data Analytics Interface Display
Premium
Data flow from database and cloud to processing and analytics dashboards, representing data analysis, automation, insight generation, and digital intelligence Vouch
Premium
Futuristic Digital Growth Chart – 3D Bar Graph with Glowing Blue Data Visualization
Dynamic Data Graphs on Digital Interface Background
Fluctuating Digital Stock Market Data Chart
Digital Financial Chart Overlay on Modern City Skyline
Dynamic Financial Data Displays Stock Market Trends
Premium
kpi, analytics, dashboard, data, chart, A person analyzing digital KPI dashboards and charts on a laptop, representing performance metrics, data analytics, and business strategy.
Digital Finance Chart Overlaying Globe Background
Rising Digital Graph and Data Visualizations on Black Background
Green Line Rising on Digital Trading Board with Abstract Background
European Market Data Overlay with EU Flag and Financial Graphs
Premium
Business team analyzing marketing data on laptop, working with graphs and charts
Abstract Financial Data Visualization in Server Room
Analyzing Construction Growth with Digital Charts
Business Growth Concept with Graphs Overlay in Warehouse
Rising Market Trends Green Arrow Chart with Numbers
Premium
Person reviews charts and graphs showing trending product data, and global market insights
Premium
Data insights, charts, and analytics help visualize performance. Data drives strategy, analytics enhances growth, and data improves business outcomes through analytics. Vouch
Financial Data Analytics Over Modern Cityscape
World Map with Falling Line Graphs Indicating Global Economic Decline
Premium
Conceptual visual of data analysis with black woman working in the office
Dynamic Stock Market Graph with Green Arrows and Numbers
Growth Trend with Green Line Overlay and Modern Cityscape
Dynamic Financial Graphs Overlaying Modern Cityscape
Data Analytics Graphs on Digital Interface Background
Premium
Stock market analysis with candlestick chart and price movement trend line, highlighting global financial trends, stock trading, and investment strategy insights Latch
Rising Financial Data Graph on Digital Grid Background
Financial Graphs Displaying Business Trends on Grid Background
Cityscape with Digital Stock Market Graphs and Statistics
Dynamic Financial Chart with Upward Growth Arrow
Premium
Businessman analyzing digital dashboard with futuristic charts and diagrams on transparent virtual screen, concept of data analysis
Data Analytics and Financial Growth Indicators
Financial Data Graph Rendering Global Market Trends
Global Economy Displaying Growth Trends with Ukraine-NATO Financial Outlook
Rising Digital Graph Overlay on City Skyline at Dusk
Green Financial Line Chart Over Modern Office Buildings
Premium
Discussing two professionals reviewing laptop data in open-plan office, with chart overlays. Collaboration, data analysis, modern workspace, professional environment, digital visualization, teamwork
Dynamic Stock Market Graphs Over Digital Interface
Dynamic Financial Data Visualizations on Grid Interface
Financial Graph Analysis on Green Grid Background
Premium
A digital interface shows data visualizations and analytics being interacted with on a laptop, highlighting technology and data analysis.
Premium
Close-up of woman wearing glasses reflecting digital bar charts and graphs, symbolizing data analysis, technology, and statistics. Concept of business, modern technologies, finance. Banner
Digital Data Overlay on Urban Skyline Examining Global Business Trends
Analyzing Stock Market Trends with Dynamic Graphs and Data
Premium
Data analytics and big data strategy for real-time analytics, predictive data modeling, business intelligence analytics, and data-driven decision-making in modern digital businesses. Spline
Premium
Businessman using futuristic user interface with virtual data analytics. Innovative dashboard with financial charts, graphs, and global network information for business intelligence.
Futuristic Digital Graph Showing Data Trends on Analytic Interface
Digital Stock Market Graph Red Trendline on Green Background
Financial Data Statistics Visualized in Urban Setting
Dynamic Green Stock Market Chart with Upward Arrows
Dynamic Financial Data Visualization on Digital Grid Background
Dynamic Stock Market Chart with Fluctuating Trends and Data Points
Global Finance and Data Analytics in Server Environment
Digital Stock Market Green Graph Against Dark Trading Board
Financial Graphs Overlaying Shopping Bag Representation Economy
Digital Financial Data Graph Showcasing Market Trends
Financial Growth Curve Over City Skyline Displaying Business Trends
Dynamic Stock Market Graph with ECO Icons
Digital Interface Display Over Urban Skyline for Financial Analytics
Dynamic Stock Market Graph Displaying Surging Growth
Innovative Data Analysis with Dynamic Line Graph and Digital Elements
Premium
 healthcare professional uses a futuristic dashboard with digital graphs, health icons and trend analysis in a smart hospital setting
Cityscape Overlay with Data Visualization
Rising Graph Line on Digital Green Grid Background
Statistical Data Processing with Graph Overlay on Buildings
Stagflation Concept with Red Graph Overlay on Cityscape
Premium
Data flow from database and cloud to processing and analytics dashboards, representing data analysis, automation, insight generation, and digital intelligence Latch
City Skyline with Overlay of Financial Market Trends
Dynamic Green Line Graph Depicting Financial Data
Diverse Business Team with Digital Growth Graph Overlay
Line Graphs on Digital Background Show Financial Data Trends
Premium
Marketing analysis of customer behavior data. Graphs of statistical web analytics and predictive financial analytics on dashboard. Analyst using laptop computer to analyze data.
Data Processing and Stagflation Concept with NATO Emblem
Global Economic Trends Highlighted on World Map with Graphs
Financial Data Flow against Urban Skyline Backdrop
Digital Data Analysis over Cityscape Stock Market Concept
Colleagues Analyzing Financial Data on Digital Grid Interface
Abstract Circuit Brain with Financial Growth Concept
Premium
Sales data analysis dashboard showing performance, trends, and insights. Sales data tracks growth, supports decisions, sales data boosts strategy, and sales data drives performance. Latch
Financial Growth Stock Nikkei in Urban City Skyline
Digital Graphs and Data Visualization on Green Background
Explore More Free Stock Images