
- Home >
- Stock Photos >
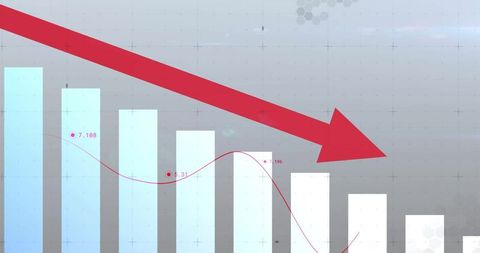
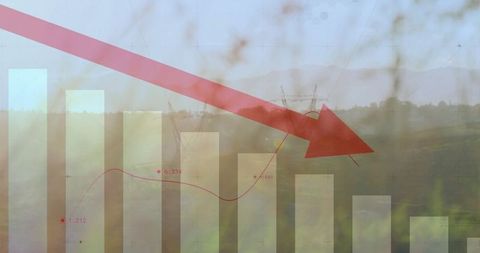
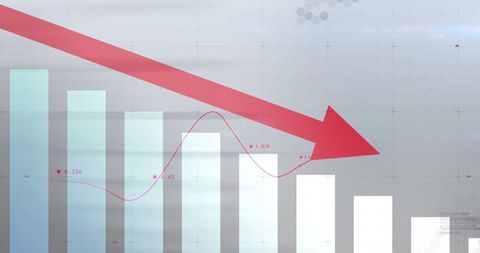
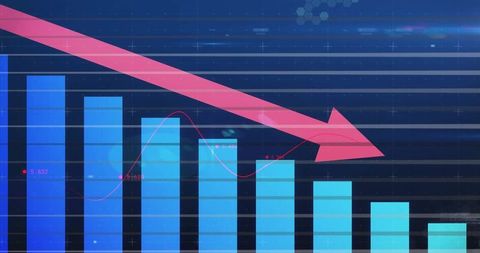
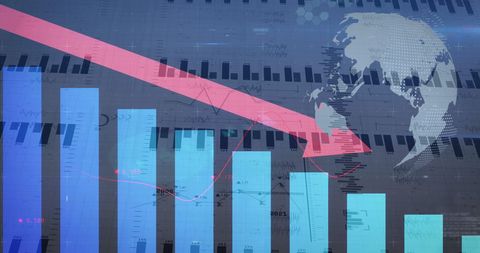
- Futuristic Data Analysis Dashboard with Declining Trend Visual
Futuristic Data Analysis Dashboard with Declining Trend Visual Image

Dynamic visual depicting financial data analytics features vibrant bars overshadowed by significant downward trending red arrow. Golden particle motifs accent futuristic theme suggesting complexity and advanced tech browse. Ideal for illustrating economic, financial decline reports, presentations depicting market prognosis.”--
Powered by 


downloads
Tags:
More
Credit Photo
If you would like to credit the Photo, here are some ways you can do so
Text Link
photo Link
<span class="text-link">
<span>
<a target="_blank" href=https://pikwizard.com/photo/futuristic-data-analysis-dashboard-with-declining-trend-visual/b67497294713130d33c71f2d36dddc38/>PikWizard</a>
</span>
</span>
<span class="image-link">
<span
style="margin: 0 0 20px 0; display: inline-block; vertical-align: middle; width: 100%;"
>
<a
target="_blank"
href="https://pikwizard.com/photo/futuristic-data-analysis-dashboard-with-declining-trend-visual/b67497294713130d33c71f2d36dddc38/"
style="text-decoration: none; font-size: 10px; margin: 0;"
>
<img src="https://pikwizard.com/pw/medium/b67497294713130d33c71f2d36dddc38.jpg" style="margin: 0; width: 100%;" alt="" />
<p style="font-size: 12px; margin: 0;">PikWizard</p>
</a>
</span>
</span>
Free (free of charge)
Free for personal and commercial use.
Author: Creative Art
Similar Free Stock Images

Premium


Premium


Premium


Premium


Premium


Premium

Premium


Premium


Premium


Premium


Premium


Premium


Premium


Premium


Premium

Premium

Premium


Premium


Premium


Premium

Premium


Premium


Premium


Premium


Premium


Explore More Free Stock Images