
- Home >
- Stock Photos >
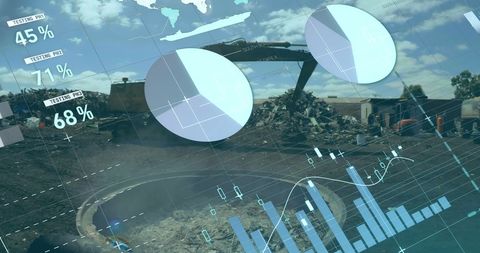
- Futuristic Data Analysis Digital Interface with Graphs and Equations
Futuristic Data Analysis Digital Interface with Graphs and Equations Image

This composition features a digital interface displaying dynamic graphs and equations. Perfect for illustrating data analysis, technological advancements, or futuristic business presentations. Use in contexts related to business analytics, technical solutions, or educational materials involving statistics and technology.
Powered by 


downloads
Tags:
More
Credit Photo
If you would like to credit the Photo, here are some ways you can do so
Text Link
photo Link
<span class="text-link">
<span>
<a target="_blank" href=https://pikwizard.com/photo/futuristic-data-analysis-digital-interface-with-graphs-and-equations/0e7eb0e4aabccbda8c1c26d371f3349e/>PikWizard</a>
</span>
</span>
<span class="image-link">
<span
style="margin: 0 0 20px 0; display: inline-block; vertical-align: middle; width: 100%;"
>
<a
target="_blank"
href="https://pikwizard.com/photo/futuristic-data-analysis-digital-interface-with-graphs-and-equations/0e7eb0e4aabccbda8c1c26d371f3349e/"
style="text-decoration: none; font-size: 10px; margin: 0;"
>
<img src="https://pikwizard.com/pw/medium/0e7eb0e4aabccbda8c1c26d371f3349e.jpg" style="margin: 0; width: 100%;" alt="" />
<p style="font-size: 12px; margin: 0;">PikWizard</p>
</a>
</span>
</span>
Free (free of charge)
Free for personal and commercial use.
Author: Creative Art
Similar Free Stock Images

Premium


Premium


Premium


Premium


Premium


Premium


Premium


Premium


Premium


Premium

Premium


Premium


Premium

Premium


Premium

Premium


Premium


Premium


Premium


Premium


Premium


Premium


Premium


Premium

Premium


Explore More Free Stock Images