- Home >
- Stock Photos >
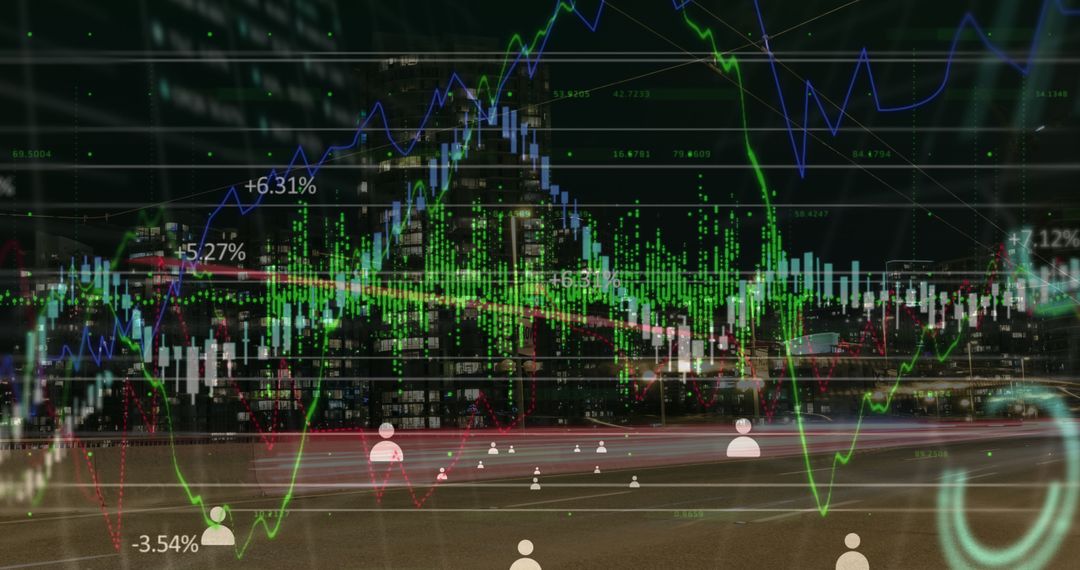
- Futuristic Data Analysis in Finance Concept with Rising Graph
Futuristic Data Analysis in Finance Concept with Rising Graph Image

Abstract representation of finance and data analysis with glowing green graph line signifying growth and upward trends. Red outline of brain symbolizes intelligence and technology integration in modern analytics. Suitable for portraying cutting-edge financial analytics, market trends forecasting, or illustrating technology-driven investment strategies.
Powered by  - Get 15% off with code: PIKWIZARD15


0
downloads
downloads
Tags:
More
Credit Photo
If you would like to credit the Photo, here are some ways you can do so
Text Link
photo Link
<span class="text-link">
<span>
<a target="_blank" href=https://pikwizard.com/photo/futuristic-data-analysis-in-finance-concept-with-rising-graph/ec559b3b583769152f58c48264bf1bc8/>PikWizard</a>
</span>
</span>
<span class="image-link">
<span
style="margin: 0 0 20px 0; display: inline-block; vertical-align: middle; width: 100%;"
>
<a
target="_blank"
href="https://pikwizard.com/photo/futuristic-data-analysis-in-finance-concept-with-rising-graph/ec559b3b583769152f58c48264bf1bc8/"
style="text-decoration: none; font-size: 10px; margin: 0;"
>
<img src="https://pikwizard.com/pw/medium/ec559b3b583769152f58c48264bf1bc8.jpg" style="margin: 0; width: 100%;" alt="" />
<p style="font-size: 12px; margin: 0;">PikWizard</p>
</a>
</span>
</span>
Free (free of charge)
Free for personal and commercial use.
Author: Creative Art
Similar Free Stock Images

Premium


Premium


Premium


Premium


Premium


Premium


Premium


Premium


Premium


Premium


Premium


Premium


Premium


Premium


Premium


Premium


Premium


Premium


Premium


Premium


Premium


Premium


Premium


Premium