
- Home >
- Stock Photos >
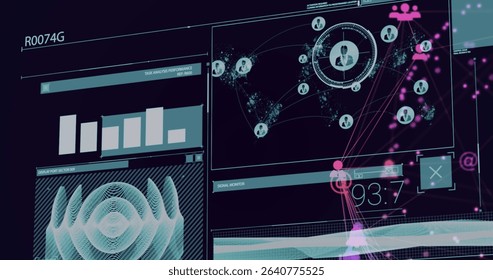
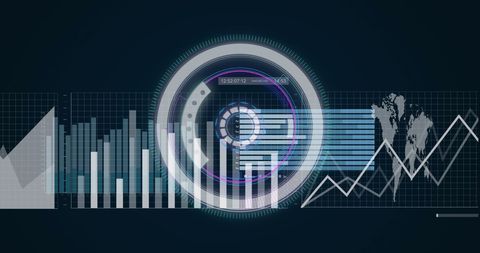
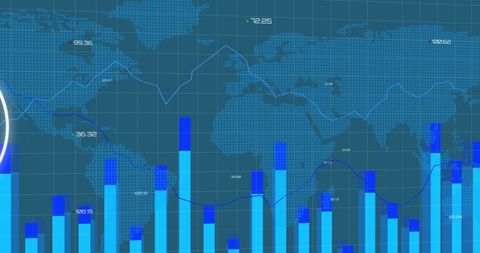
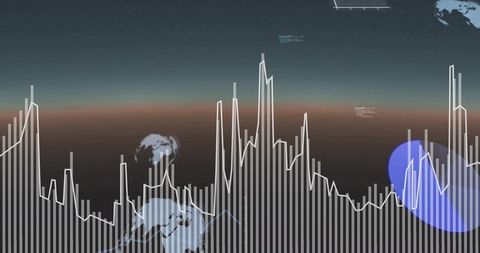
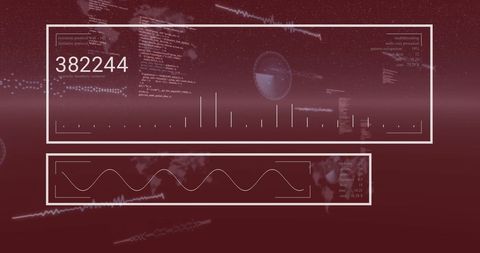
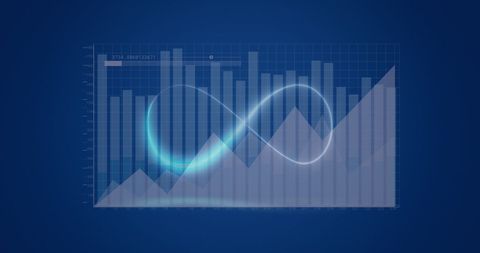
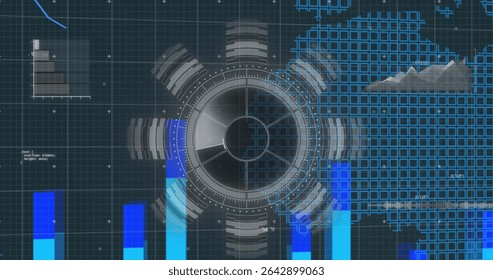
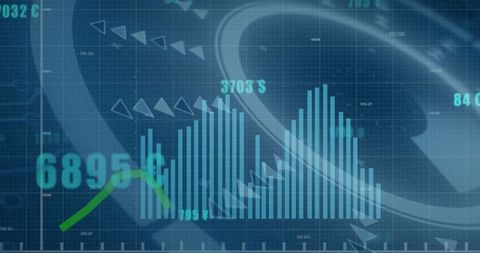
- Futuristic Data Analysis Interface with Circular Charts
Futuristic Data Analysis Interface with Circular Charts Image

Visual showcasing modern technology concept with spinning circular charts set against complex data sets. Ideal for presentations on business intelligence, data analytics, and statistics; can be used for illustrating articles on futuristic data processing tools and techniques.
Powered by  - Get 15% off with code: PIKWIZARD15


downloads
Tags:
More
Credit Photo
If you would like to credit the Photo, here are some ways you can do so
Text Link
photo Link
<span class="text-link">
<span>
<a target="_blank" href=https://pikwizard.com/photo/futuristic-data-analysis-interface-with-circular-charts/d20bf83d139c833eb812cf872ae21de9/>PikWizard</a>
</span>
</span>
<span class="image-link">
<span
style="margin: 0 0 20px 0; display: inline-block; vertical-align: middle; width: 100%;"
>
<a
target="_blank"
href="https://pikwizard.com/photo/futuristic-data-analysis-interface-with-circular-charts/d20bf83d139c833eb812cf872ae21de9/"
style="text-decoration: none; font-size: 10px; margin: 0;"
>
<img src="https://pikwizard.com/pw/medium/d20bf83d139c833eb812cf872ae21de9.jpg" style="margin: 0; width: 100%;" alt="" />
<p style="font-size: 12px; margin: 0;">PikWizard</p>
</a>
</span>
</span>
Free (free of charge)
Free for personal and commercial use.
Author: Authentic Images
Similar Free Stock Images

Premium


Premium

Premium


Premium


Premium


Premium


Premium


Premium

Premium

Premium

Premium


Premium


Premium


Premium


Premium


Premium


Premium


Premium


Premium


Premium


Premium

Premium


Premium


Premium


Premium


Explore More Free Stock Images