
- Home >
- Stock Photos >
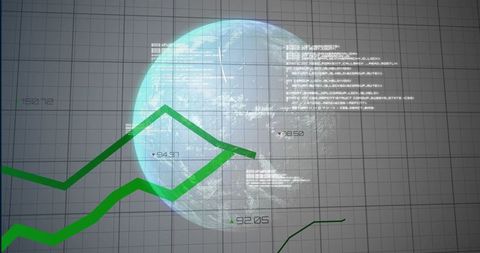
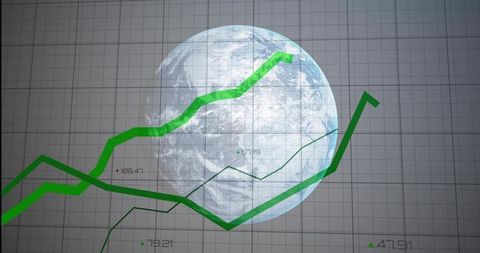
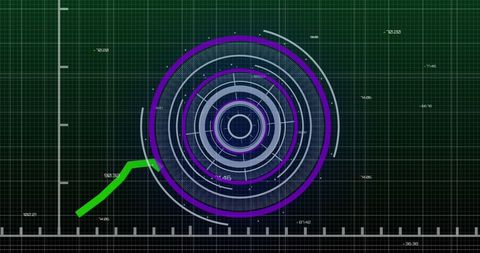
- Futuristic Data Analysis Interface with Green Trend Lines
Futuristic Data Analysis Interface with Green Trend Lines Image

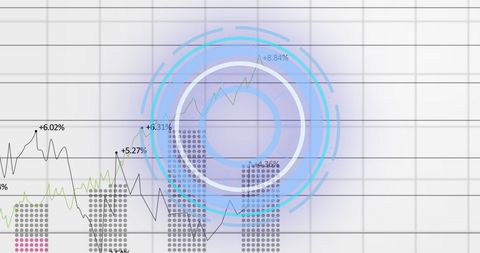
Concentric blue circles enhance two green line graphs on modern digital interface. Aligns with innovative trends in data analysis and finance communications. Suitable for technological articles, business development visual aids, and training materials.
Powered by 


downloads
Tags:
More
Credit Photo
If you would like to credit the Photo, here are some ways you can do so
Text Link
photo Link
<span class="text-link">
<span>
<a target="_blank" href=https://pikwizard.com/photo/futuristic-data-analysis-interface-with-green-trend-lines/15324b722a535aaaf4d0dd1f9a810d5c/>PikWizard</a>
</span>
</span>
<span class="image-link">
<span
style="margin: 0 0 20px 0; display: inline-block; vertical-align: middle; width: 100%;"
>
<a
target="_blank"
href="https://pikwizard.com/photo/futuristic-data-analysis-interface-with-green-trend-lines/15324b722a535aaaf4d0dd1f9a810d5c/"
style="text-decoration: none; font-size: 10px; margin: 0;"
>
<img src="https://pikwizard.com/pw/medium/15324b722a535aaaf4d0dd1f9a810d5c.jpg" style="margin: 0; width: 100%;" alt="" />
<p style="font-size: 12px; margin: 0;">PikWizard</p>
</a>
</span>
</span>
Free (free of charge)
Free for personal and commercial use.
Author: Authentic Images
Similar Free Stock Images

Premium


Premium


Premium


Premium


Premium


Premium


Premium


Premium


Premium

Premium

Premium


Premium


Premium


Premium


Premium


Premium


Premium

Premium


Premium


Premium

Premium

Premium


Premium

Premium


Premium


Explore More Free Stock Images