- Home >
- Stock Photos >
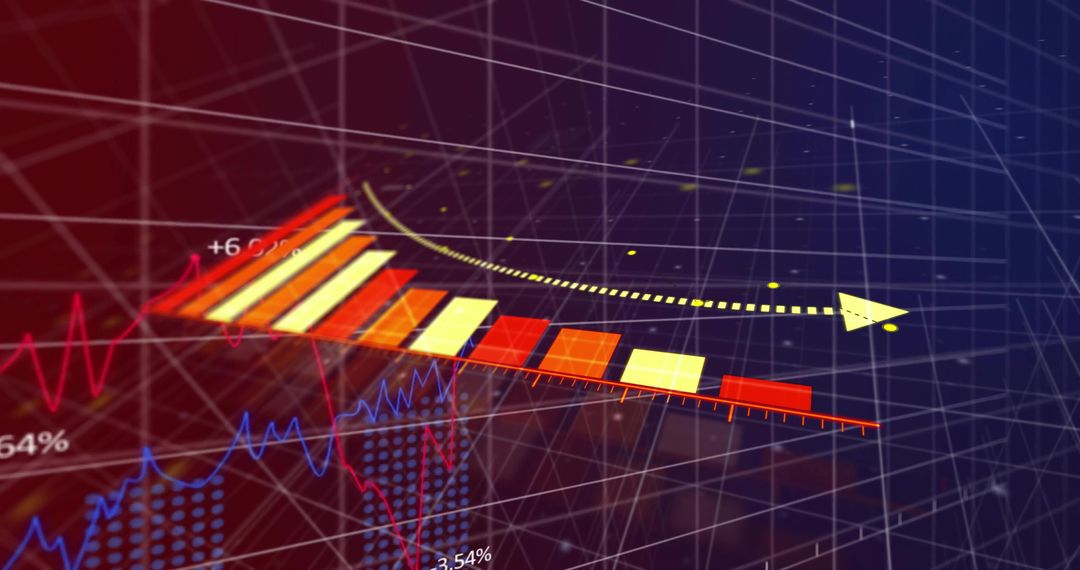
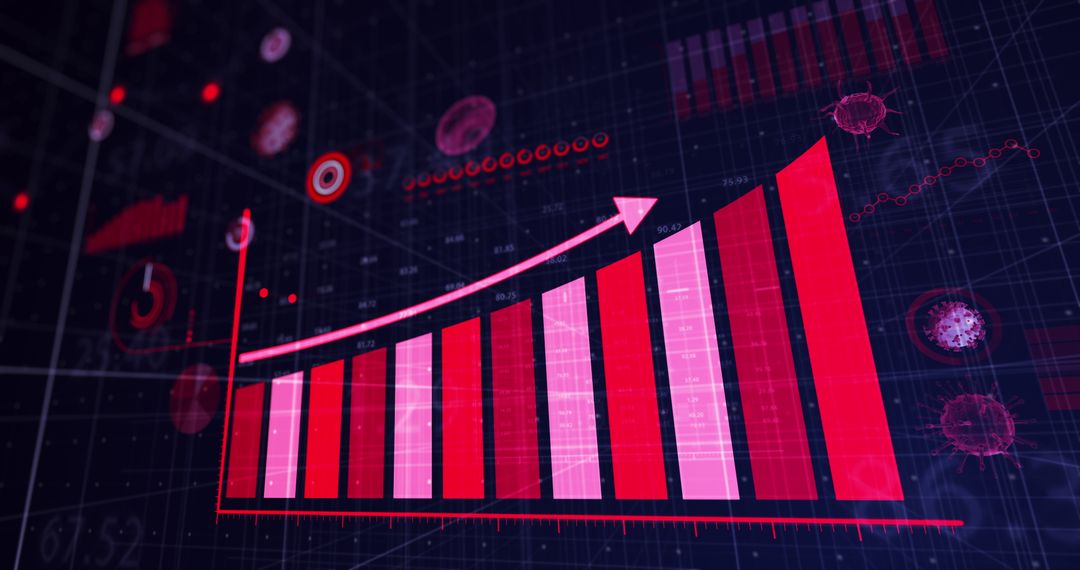
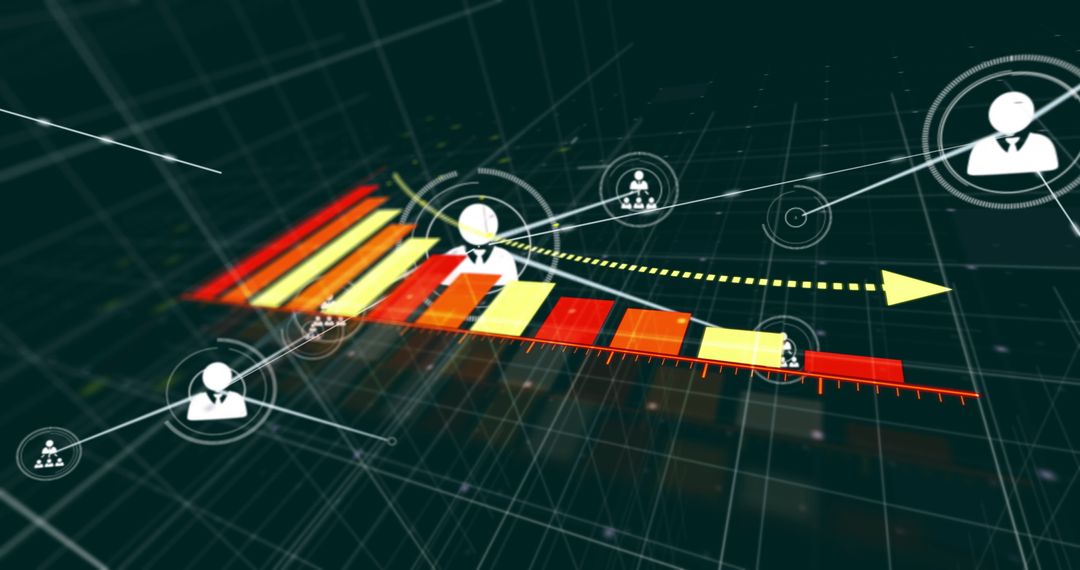
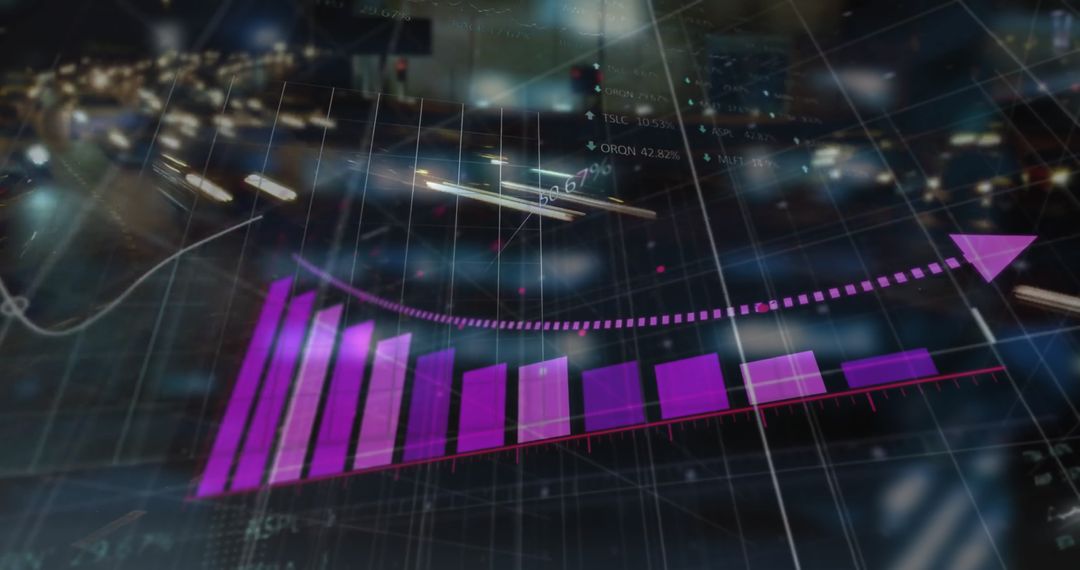
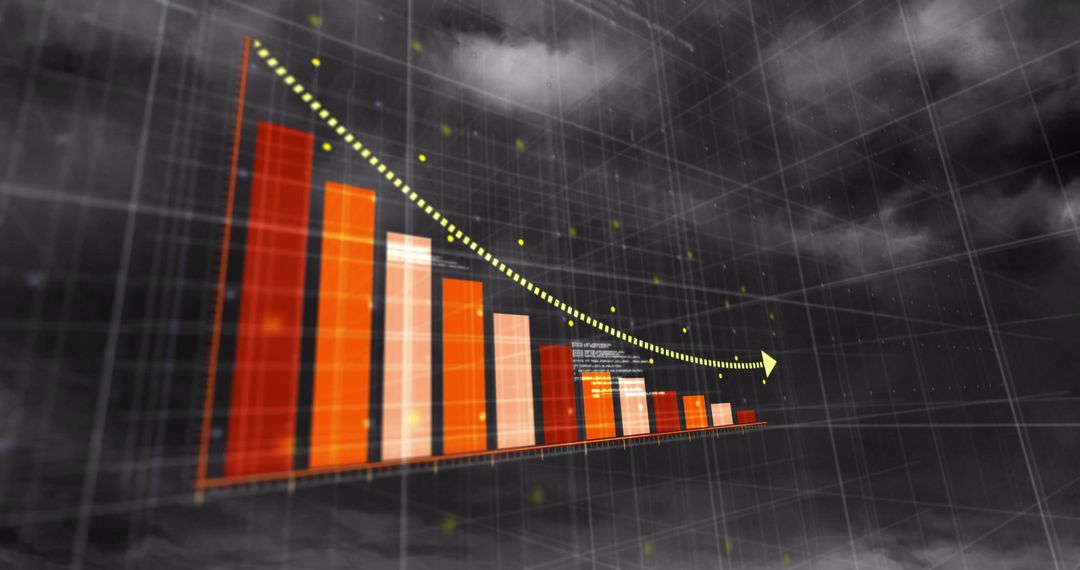
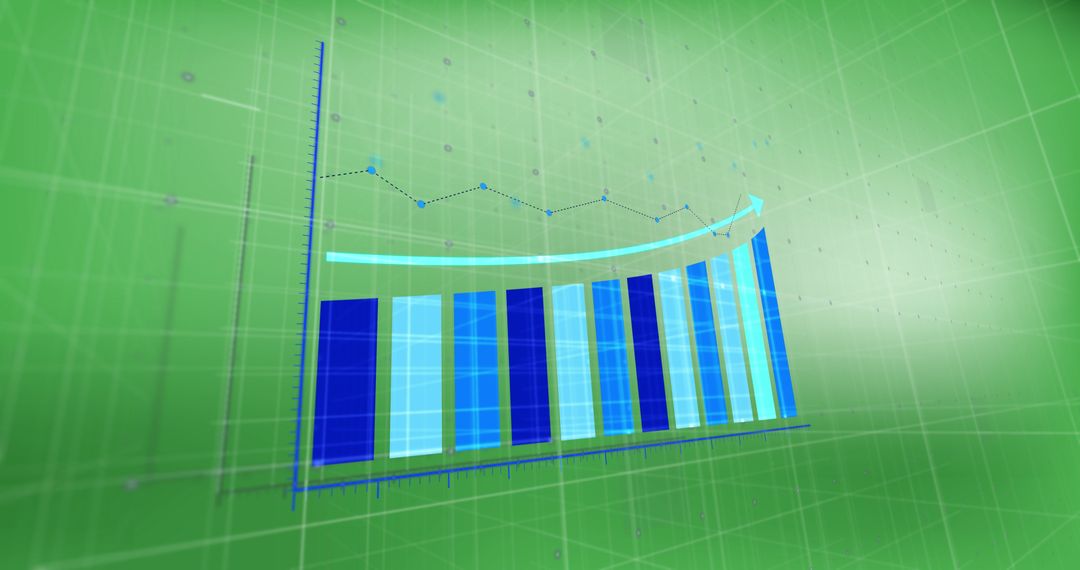
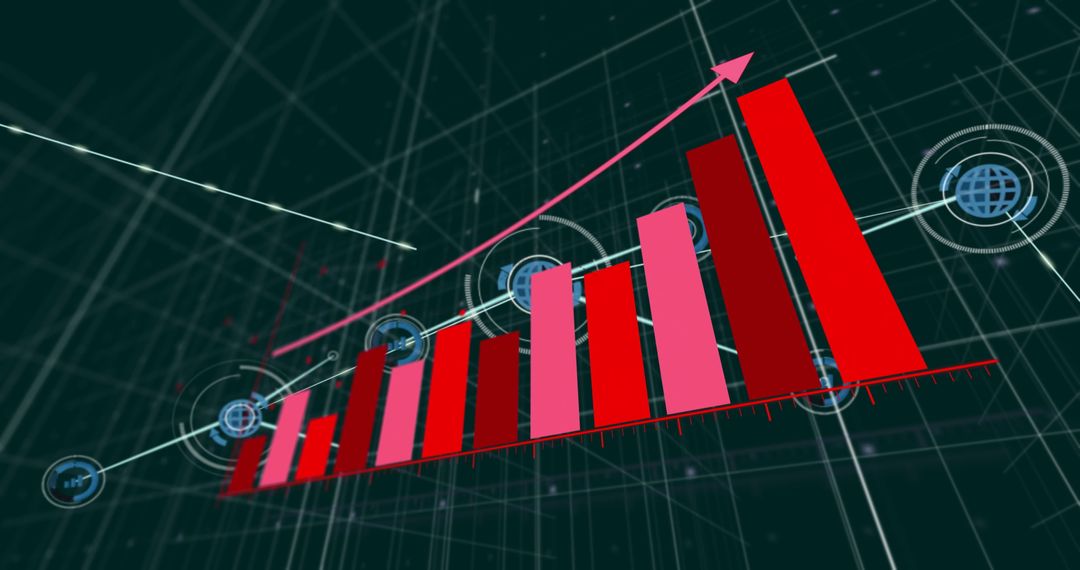
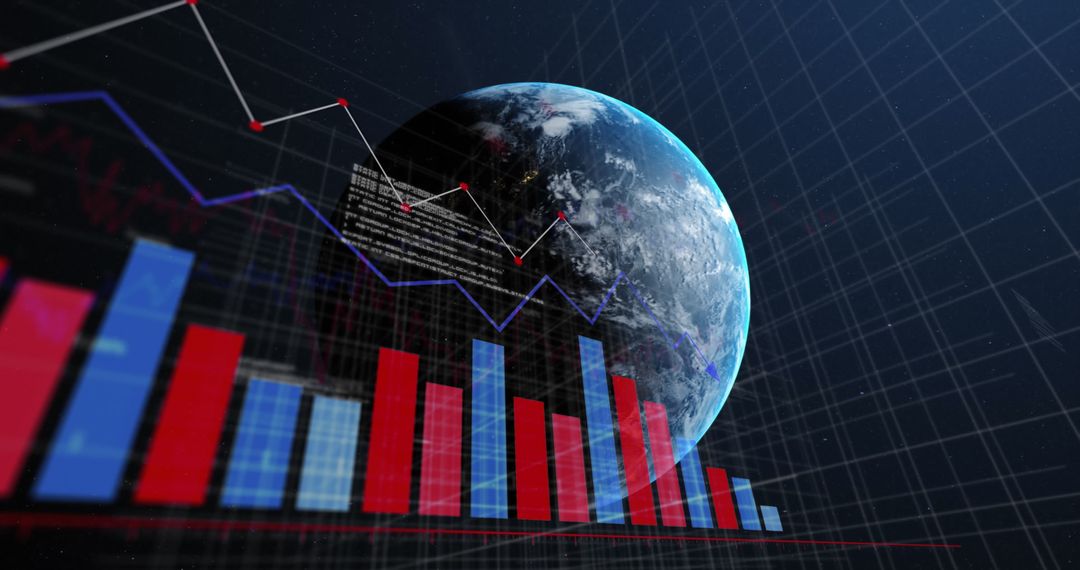
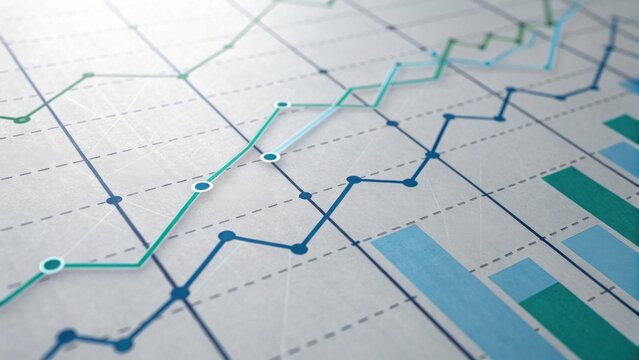
- Futuristic Data Analysis with Bar and Line Charts
Futuristic Data Analysis with Bar and Line Charts Image
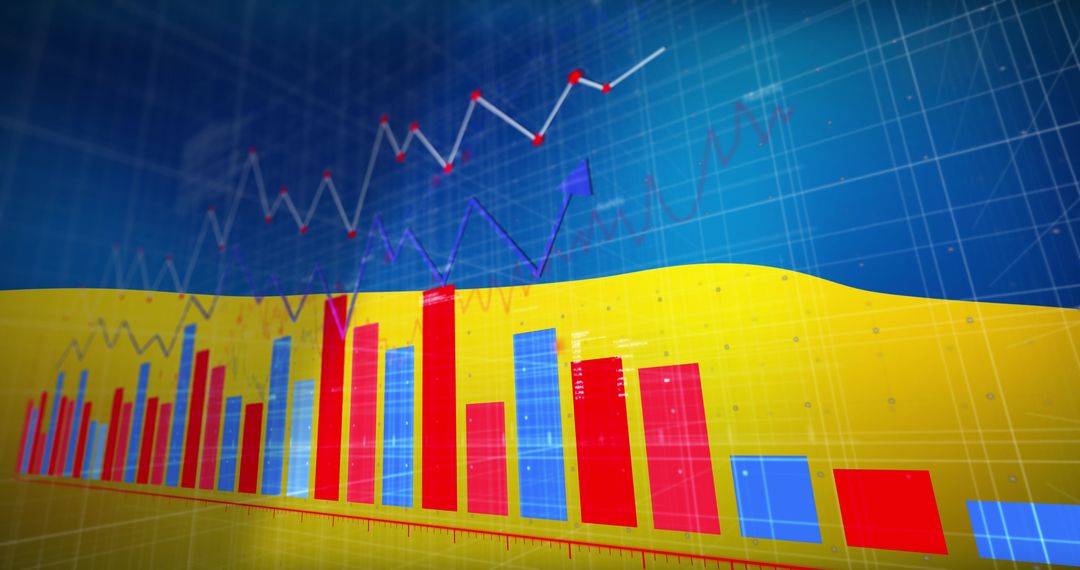
Bar and line charts over an abstract background suggest advanced data analysis. Suitable for illustrating financial insights, data analytics, and statistics in business presentations, corporate reports, or educational materials. The glowing elements add a futuristic touch, ideal for tech-related content.
Powered by 


2
downloads
downloads
Tags:
More
Credit Photo
If you would like to credit the Photo, here are some ways you can do so
Text Link
photo Link
<span class="text-link">
<span>
<a target="_blank" href=https://pikwizard.com/photo/futuristic-data-analysis-with-bar-and-line-charts/d49e5c41821cb497101ec80c74009f61/>PikWizard</a>
</span>
</span>
<span class="image-link">
<span
style="margin: 0 0 20px 0; display: inline-block; vertical-align: middle; width: 100%;"
>
<a
target="_blank"
href="https://pikwizard.com/photo/futuristic-data-analysis-with-bar-and-line-charts/d49e5c41821cb497101ec80c74009f61/"
style="text-decoration: none; font-size: 10px; margin: 0;"
>
<img src="https://pikwizard.com/pw/medium/d49e5c41821cb497101ec80c74009f61.jpg" style="margin: 0; width: 100%;" alt="" />
<p style="font-size: 12px; margin: 0;">PikWizard</p>
</a>
</span>
</span>
Free (free of charge)
Free for personal and commercial use.
Author: People Creations
Similar Free Stock Images

Premium


Premium


Premium


Premium


Premium


Premium


Premium


Premium


Premium


Premium


Premium


Premium


Premium


Premium


Premium


Premium


Premium


Premium


Premium


Premium


Premium


Premium


Premium


Premium