- Home >
- Stock Photos >
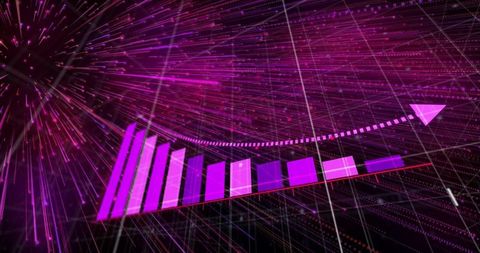
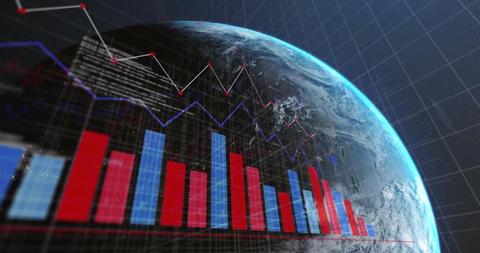
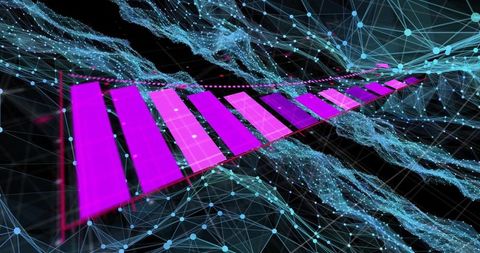
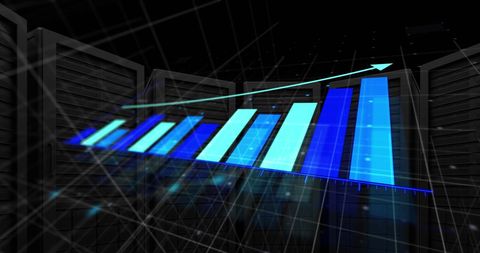
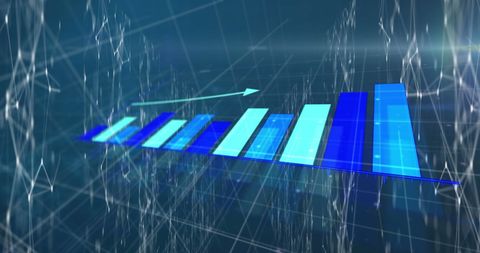
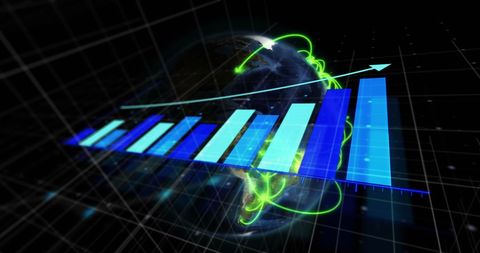
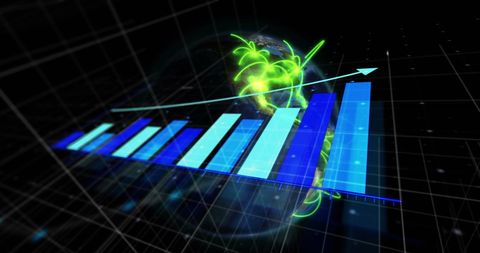
- Futuristic Data Analysis with Bars and Neon Technology
Futuristic Data Analysis with Bars and Neon Technology Image
The image represents a growing trend in business analytics with ascending 3D bars against a neon grid, suggesting futuristic and innovative data technology. The glowing sun and arrow reinforce the theme of growth and progression in digital environments. Ideal for presentations unfolding new technological advancements in business, product pitches focusing on data-centered services, marketing materials for tech-driven solutions, or articles exploring the role of visualization in data planning.

downloads
Tags:
More
Credit Photo
If you would like to credit the Photo, here are some ways you can do so
Text Link
photo Link
<span class="text-link">
<span>
<a target="_blank" href=https://pikwizard.com/photo/futuristic-data-analysis-with-bars-and-neon-technology/76d6fc56ce71970080704c3c4c9e37cf/>PikWizard</a>
</span>
</span>
<span class="image-link">
<span
style="margin: 0 0 20px 0; display: inline-block; vertical-align: middle; width: 100%;"
>
<a
target="_blank"
href="https://pikwizard.com/photo/futuristic-data-analysis-with-bars-and-neon-technology/76d6fc56ce71970080704c3c4c9e37cf/"
style="text-decoration: none; font-size: 10px; margin: 0;"
>
<img src="https://pikwizard.com/pw/medium/76d6fc56ce71970080704c3c4c9e37cf.jpg" style="margin: 0; width: 100%;" alt="" />
<p style="font-size: 12px; margin: 0;">PikWizard</p>
</a>
</span>
</span>
Free (free of charge)
Free for personal and commercial use.
Author: Awesome Content