
- Home >
- Stock Photos >
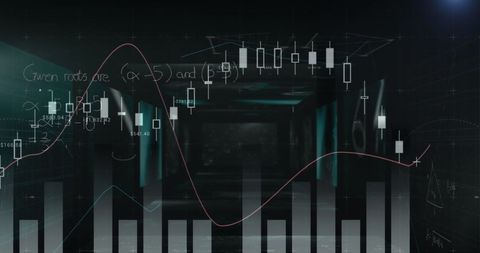
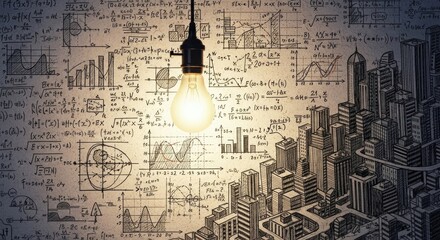
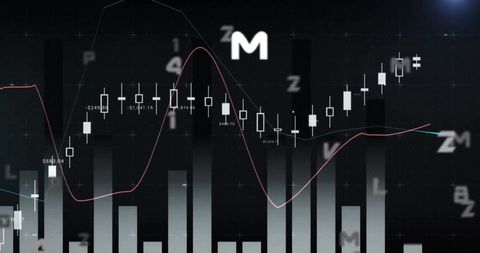
- Futuristic Data Analysis with Graphs and Formulas
Futuristic Data Analysis with Graphs and Formulas Image

An intricately designed digital environment featuring complex mathematical formulas and graphs overlaid on a screen. The composition suggests advanced data analysis through a blend of numerical data, calculated forms, and graphical elements, portraying a high-tech atmosphere. Ideal for use in presentations on finance, technology, and data analytics. Can be used by tech companies to illustrate themes related to innovation and computational analysis.
Powered by 


downloads
Tags:
More
Credit Photo
If you would like to credit the Photo, here are some ways you can do so
Text Link
photo Link
<span class="text-link">
<span>
<a target="_blank" href=https://pikwizard.com/photo/futuristic-data-analysis-with-graphs-and-formulas/a017f86fe55a66f9b6dcf55fc134f2f9/>PikWizard</a>
</span>
</span>
<span class="image-link">
<span
style="margin: 0 0 20px 0; display: inline-block; vertical-align: middle; width: 100%;"
>
<a
target="_blank"
href="https://pikwizard.com/photo/futuristic-data-analysis-with-graphs-and-formulas/a017f86fe55a66f9b6dcf55fc134f2f9/"
style="text-decoration: none; font-size: 10px; margin: 0;"
>
<img src="https://pikwizard.com/pw/medium/a017f86fe55a66f9b6dcf55fc134f2f9.jpg" style="margin: 0; width: 100%;" alt="" />
<p style="font-size: 12px; margin: 0;">PikWizard</p>
</a>
</span>
</span>
Free (free of charge)
Free for personal and commercial use.
Author: People Creations
Similar Free Stock Images

Premium

Premium

Premium


Premium

Premium


Premium


Premium


Premium


Premium


Premium


Premium


Premium


Premium


Premium
Premium


Premium


Premium

Premium


Premium


Premium

Premium


Premium


Premium


Premium


Premium

Explore More Free Stock Images