- Home >
- Stock Photos >
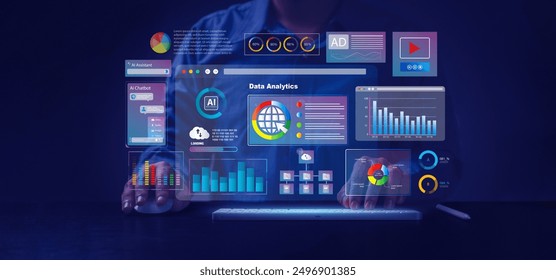
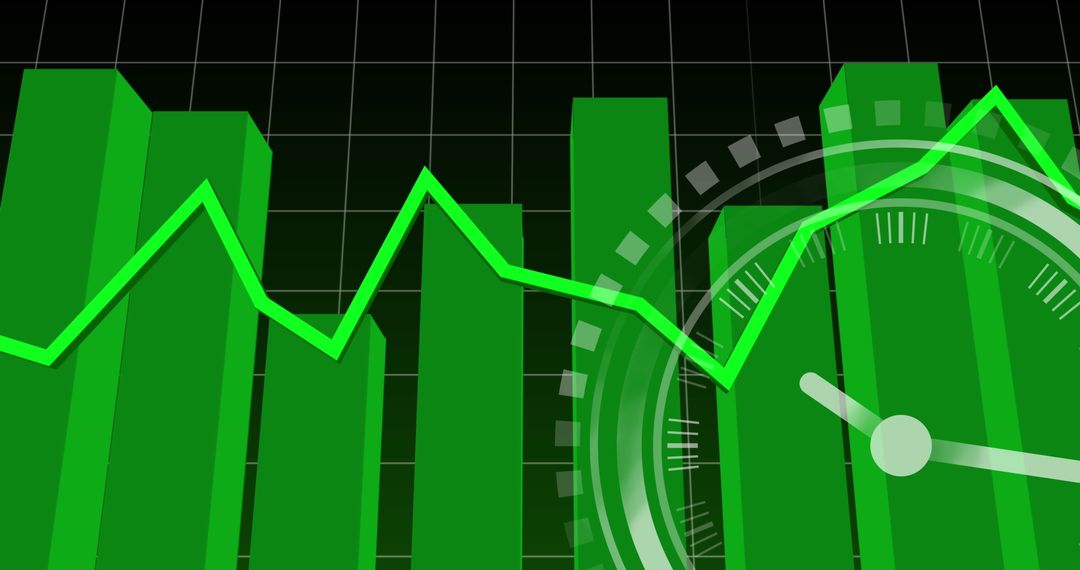
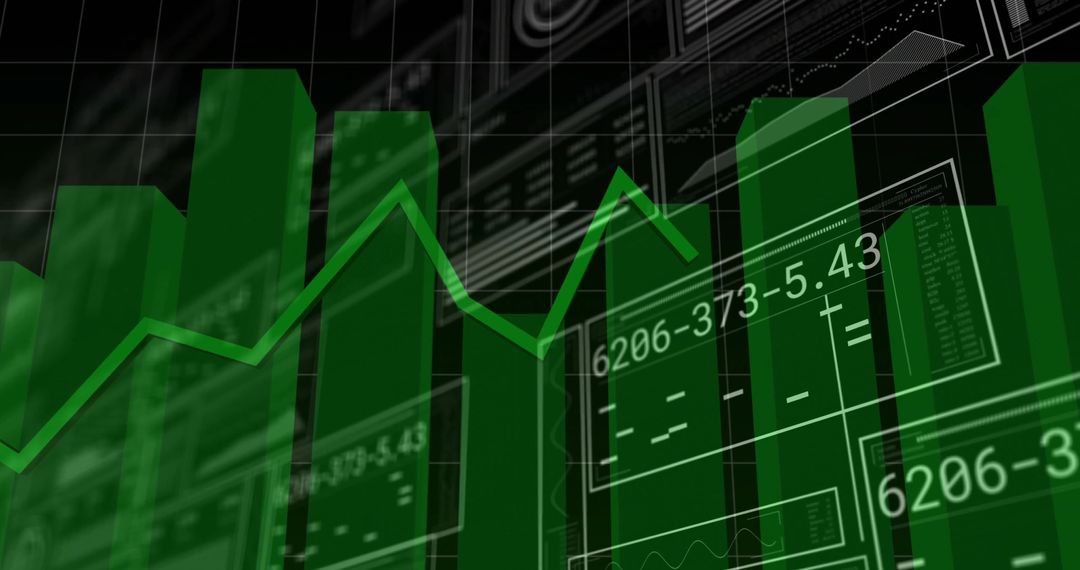
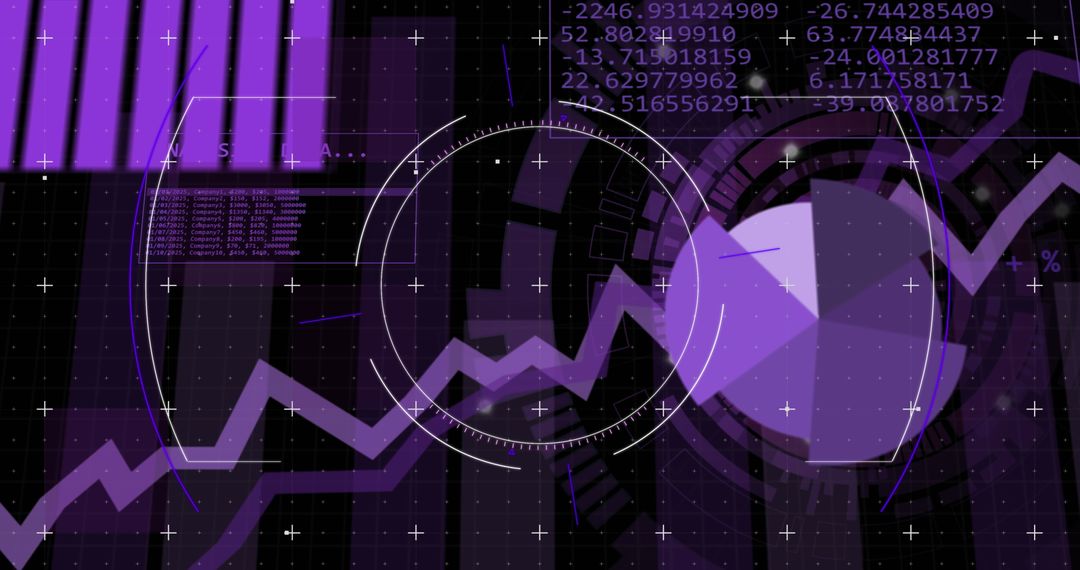
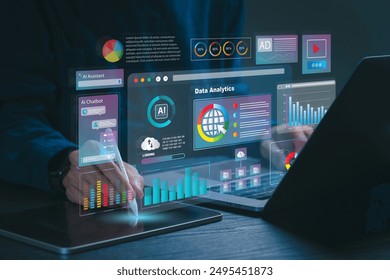
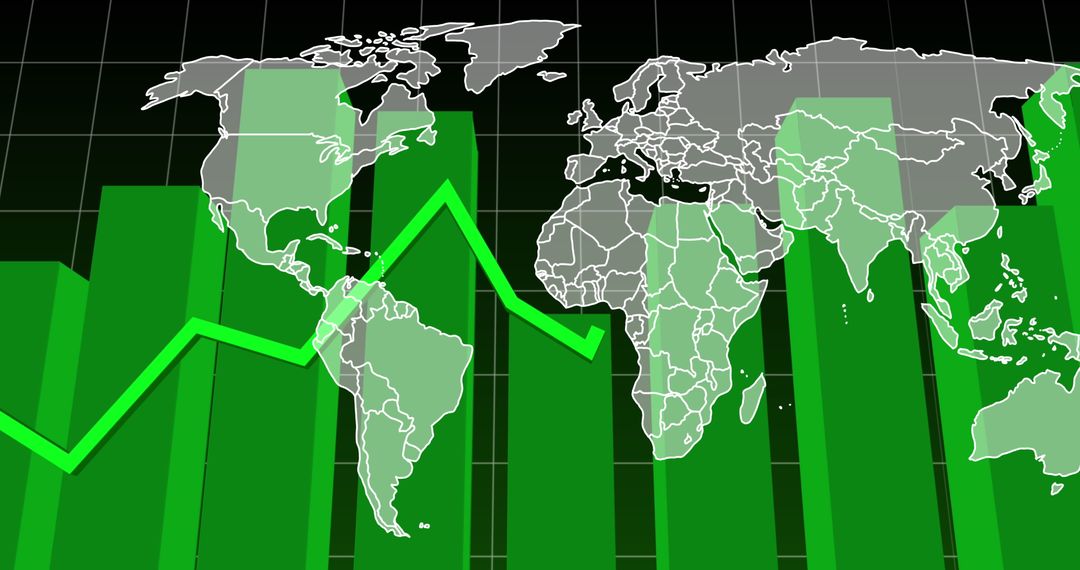
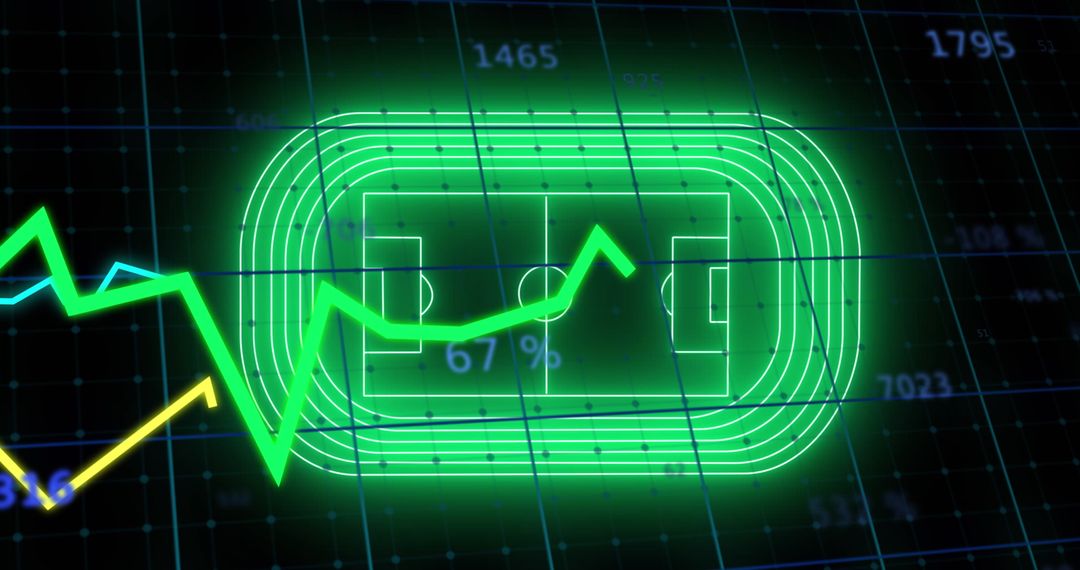
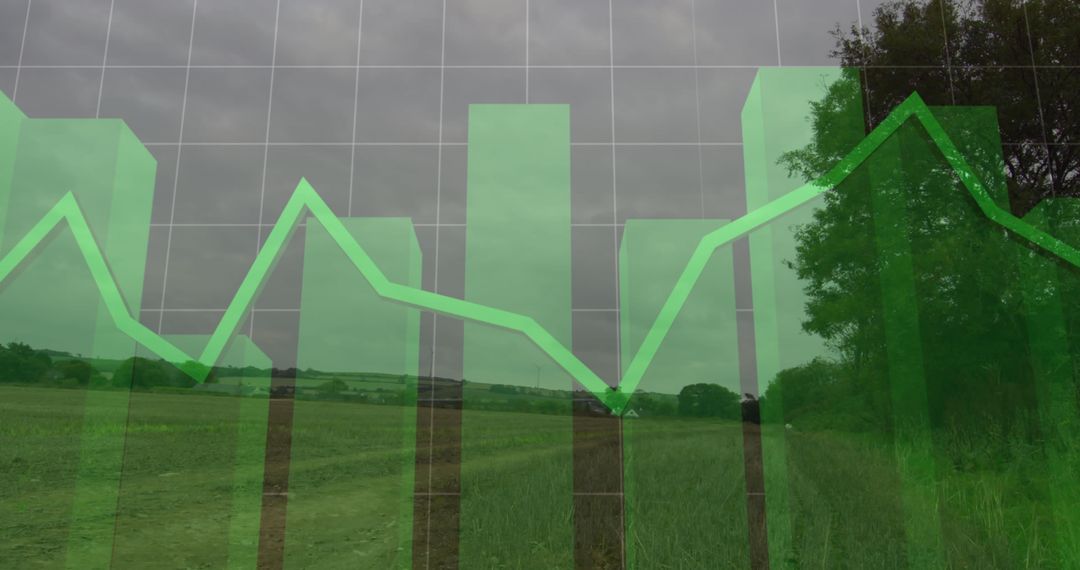
- Futuristic Data Analysis with Graphs and Scanner Overlay
Futuristic Data Analysis with Graphs and Scanner Overlay Image

Visual illustrates futuristic data analysis concepts with neon graphs and groundbreaking scanner overlays. Shows integration of technology and finance. Ideal for presentations on business intelligence, financial forecasting, and tech-driven analysis.
Powered by  - Get 15% off with code: PIKWIZARD15


4
downloads
downloads
Tags:
More
Credit Photo
If you would like to credit the Photo, here are some ways you can do so
Text Link
photo Link
<span class="text-link">
<span>
<a target="_blank" href=https://pikwizard.com/photo/futuristic-data-analysis-with-graphs-and-scanner-overlay/9a00e8298fe443c55d3427d5d3950caf/>PikWizard</a>
</span>
</span>
<span class="image-link">
<span
style="margin: 0 0 20px 0; display: inline-block; vertical-align: middle; width: 100%;"
>
<a
target="_blank"
href="https://pikwizard.com/photo/futuristic-data-analysis-with-graphs-and-scanner-overlay/9a00e8298fe443c55d3427d5d3950caf/"
style="text-decoration: none; font-size: 10px; margin: 0;"
>
<img src="https://pikwizard.com/pw/medium/9a00e8298fe443c55d3427d5d3950caf.jpg" style="margin: 0; width: 100%;" alt="" />
<p style="font-size: 12px; margin: 0;">PikWizard</p>
</a>
</span>
</span>
Free (free of charge)
Free for personal and commercial use.
Author: Awesome Content
Similar Free Stock Images

Premium


Premium


Premium


Premium


Premium


Premium


Premium


Premium


Premium


Premium


Premium


Premium


Premium


Premium


Premium


Premium


Premium


Premium


Premium


Premium


Premium


Premium


Premium


Premium