- Home >
- Stock Photos >
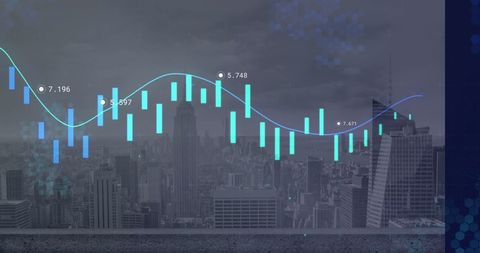
- Futuristic Data Analysis with Interactive Graphs
Futuristic Data Analysis with Interactive Graphs Image

Illustrates futuristic data analysis overlaid with colorful graphs and charts. Ideal for technology articles, financial analysis, and presentations focusing on global economy themes. Also suitable for promotional materials emphasizing data-driven insights and leap in technological advancement.

downloads
Tags:
More
Credit Photo
If you would like to credit the Photo, here are some ways you can do so
Text Link
photo Link
<span class="text-link">
<span>
<a target="_blank" href=https://pikwizard.com/photo/futuristic-data-analysis-with-interactive-graphs/8abc81822f0bde8b05f7e4d17dc02f15/>PikWizard</a>
</span>
</span>
<span class="image-link">
<span
style="margin: 0 0 20px 0; display: inline-block; vertical-align: middle; width: 100%;"
>
<a
target="_blank"
href="https://pikwizard.com/photo/futuristic-data-analysis-with-interactive-graphs/8abc81822f0bde8b05f7e4d17dc02f15/"
style="text-decoration: none; font-size: 10px; margin: 0;"
>
<img src="https://pikwizard.com/pw/medium/8abc81822f0bde8b05f7e4d17dc02f15.jpg" style="margin: 0; width: 100%;" alt="" />
<p style="font-size: 12px; margin: 0;">PikWizard</p>
</a>
</span>
</span>
Free (free of charge)
Free for personal and commercial use.
Author: People Creations