- Home >
- Stock Photos >
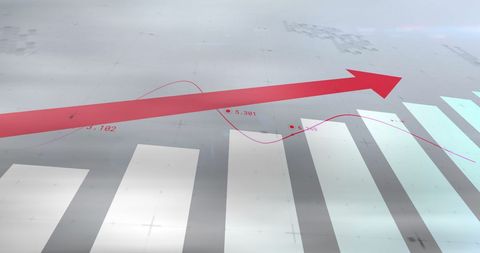
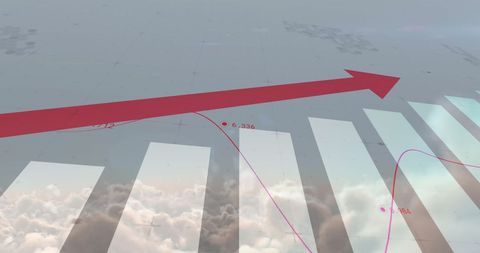
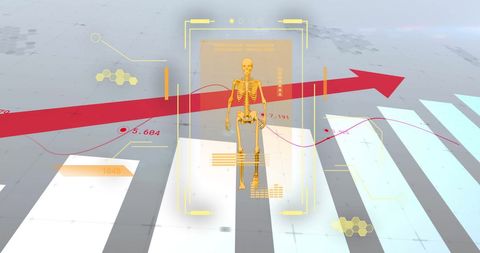
- Futuristic Data Analysis with Technology Interface
Futuristic Data Analysis with Technology Interface Image

Conceptual digital interface illustrating futuristic data analysis with holographic elements such as a brain simulation and data diagrams. Imagining the intersection of technology and science, offering insights for presentations on AI, digital transformation, and innovative research methods.

downloads
Tags:
More
Credit Photo
If you would like to credit the Photo, here are some ways you can do so
Text Link
photo Link
<span class="text-link">
<span>
<a target="_blank" href=https://pikwizard.com/photo/futuristic-data-analysis-with-technology-interface/0c552b09f90b04638f64c82545fa492f/>PikWizard</a>
</span>
</span>
<span class="image-link">
<span
style="margin: 0 0 20px 0; display: inline-block; vertical-align: middle; width: 100%;"
>
<a
target="_blank"
href="https://pikwizard.com/photo/futuristic-data-analysis-with-technology-interface/0c552b09f90b04638f64c82545fa492f/"
style="text-decoration: none; font-size: 10px; margin: 0;"
>
<img src="https://pikwizard.com/pw/medium/0c552b09f90b04638f64c82545fa492f.jpg" style="margin: 0; width: 100%;" alt="" />
<p style="font-size: 12px; margin: 0;">PikWizard</p>
</a>
</span>
</span>
Free (free of charge)
Free for personal and commercial use.
Author: Creative Art