- Home >
- Stock Photos >
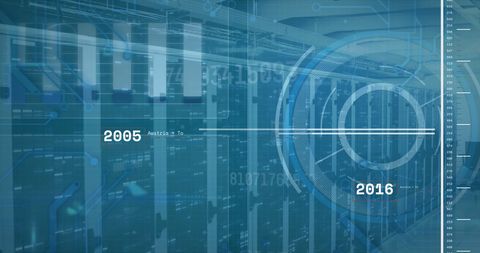
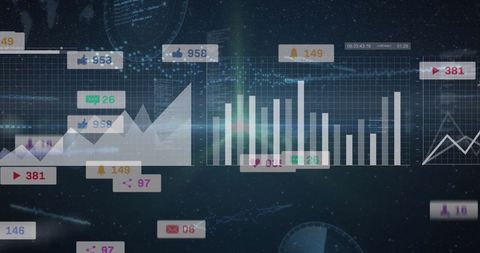
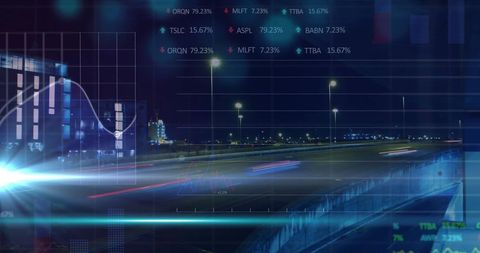
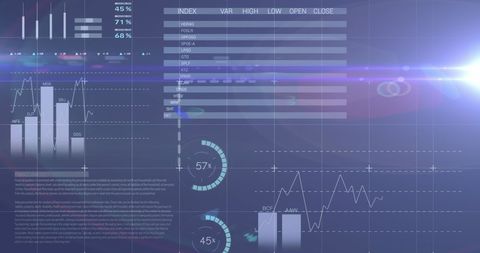
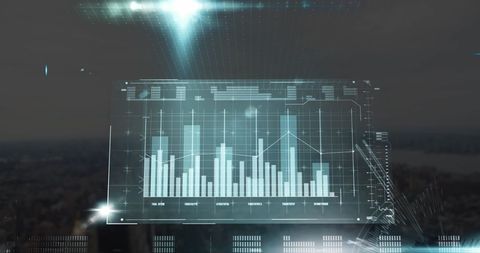
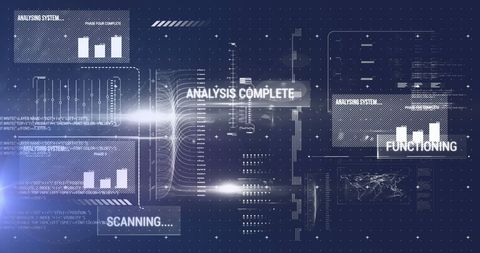
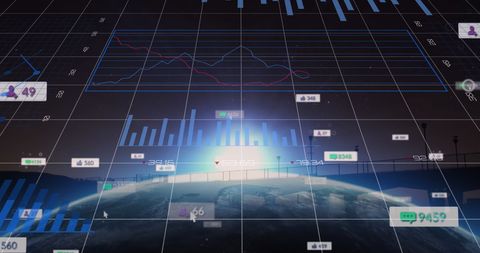
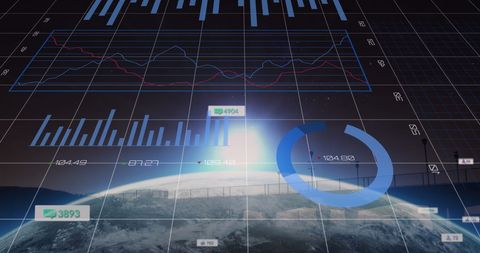
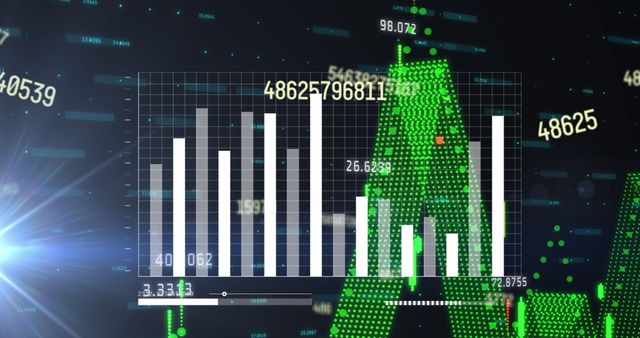
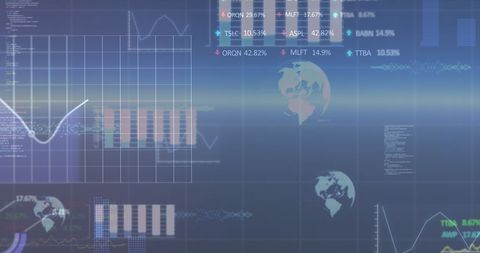
- Futuristic Data Analytics and Visualization Interface
Futuristic Data Analytics and Visualization Interface Image

This depiction of a contemporary and futuristic digital interface includes various graphs and analytics elements, providing a sense of advanced technology and innovation. Useful for conveying concepts of big data analysis, trends in technology, and modern digital transformations. Ideal for use in presentations, infographics, blog posts related to tech industry and scientific research, advertisements for IT services, or in illustrating themes of modern technology development and network interfacing.

downloads
Tags:
More
Credit Photo
If you would like to credit the Photo, here are some ways you can do so
Text Link
photo Link
<span class="text-link">
<span>
<a target="_blank" href=https://pikwizard.com/photo/futuristic-data-analytics-and-visualization-interface/3efd8e5cc3b2c5efb61fc769b7127daa/>PikWizard</a>
</span>
</span>
<span class="image-link">
<span
style="margin: 0 0 20px 0; display: inline-block; vertical-align: middle; width: 100%;"
>
<a
target="_blank"
href="https://pikwizard.com/photo/futuristic-data-analytics-and-visualization-interface/3efd8e5cc3b2c5efb61fc769b7127daa/"
style="text-decoration: none; font-size: 10px; margin: 0;"
>
<img src="https://pikwizard.com/pw/medium/3efd8e5cc3b2c5efb61fc769b7127daa.jpg" style="margin: 0; width: 100%;" alt="" />
<p style="font-size: 12px; margin: 0;">PikWizard</p>
</a>
</span>
</span>
Free (free of charge)
Free for personal and commercial use.
Author: Awesome Content