- Home >
- Stock Photos >
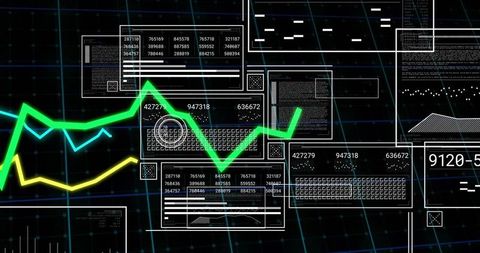
- Futuristic Data Analytics Dashboard with 3D Graph Visualization
Futuristic Data Analytics Dashboard with 3D Graph Visualization Image

Illustrates advanced data analysis on a digital dashboard featuring three-dimensional graph visualization and colorful data lines against a dark grid background. Captures the essence of technology and financial analytics, suitable for depicting high tech, modern business environments often used in presentations, financial reports, and tech websites to convey digital innovation and data-driven decision making.

downloads
Tags:
More
Credit Photo
If you would like to credit the Photo, here are some ways you can do so
Text Link
photo Link
<span class="text-link">
<span>
<a target="_blank" href=https://pikwizard.com/photo/futuristic-data-analytics-dashboard-with-3d-graph-visualization/279e28962d1f2f562c623d4e05f826b9/>PikWizard</a>
</span>
</span>
<span class="image-link">
<span
style="margin: 0 0 20px 0; display: inline-block; vertical-align: middle; width: 100%;"
>
<a
target="_blank"
href="https://pikwizard.com/photo/futuristic-data-analytics-dashboard-with-3d-graph-visualization/279e28962d1f2f562c623d4e05f826b9/"
style="text-decoration: none; font-size: 10px; margin: 0;"
>
<img src="https://pikwizard.com/pw/medium/279e28962d1f2f562c623d4e05f826b9.jpg" style="margin: 0; width: 100%;" alt="" />
<p style="font-size: 12px; margin: 0;">PikWizard</p>
</a>
</span>
</span>
Free (free of charge)
Free for personal and commercial use.
Author: Awesome Content