1. Home > 
  2. Stock Photos > 
  3. Futuristic Data Analytics Dashboard with Bar and Line Graphs

Futuristic Data Analytics Dashboard with Bar and Line Graphs Image

Futuristic Data Analytics Dashboard with Bar and Line Graphs

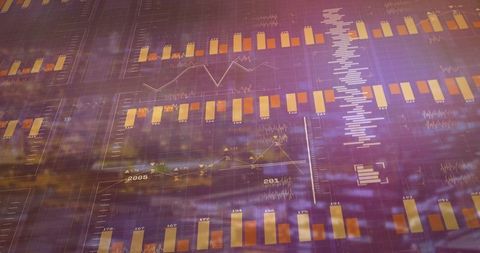
Visualizing complex data collections through a futuristic user interface with vertical bar and line graphs. Ideal for projects on data analytics, business intelligence, techno-focused presentation themes, and educational resources emphasizing digital progress and innovation.

Powered by Adobe logo
Analyst works with business analytics data management system. Generates reports with KPIs metrics linked database. Strategizing corporate finance operations sales marketing. Data analysis, modeling - Powered by AdobeFuturistic glowing blue digital dashboard with interactive charts graphs and analytics showing upward growth trend for business financial and technology data visualization concepts - Powered by AdobeDigital checklist interface with data analytics and task complet - Powered by AdobeDynamic 3D bar chart visualization with glowing lights faceless data growth representation defocused red and blue background financial analysis display modern tech environment - Powered by AdobeMarketer using digital marketing dashboard with charts, pie graphs, organization chart, and performance data. Concept of business analytics and strategic planning. - Powered by Adobe

Credit Photo

If you would like to credit the Photo, here are some ways you can do so

Free (free of charge)

Free for personal and commercial use.

Author: People Creations

Similar Free Stock Images

Digital Business Graphs with Cityscape Background Overlay
Premium
Digital sales performance dashboard showing sales performance metrics, performance trends, sales performance analytics, and sales improvement in business context. Muxer
Abstract Financial Graphs Overlaid on Modern Cityscape
Data Analytics with UK Flag Overlay on Cloudy Background
Financial Data Overlay on Power Lines and Sky
Futuristic Data Processing in Cloud Computing Concept
Premium
Futuristic digital dashboard displaying complex data and analytics
Financial Data Analytics With Global Market Overlay
Futuristic Data Display Over Cityscape with Digital Interface
Abstract Financial Technology with Digital Growth Charts
Dynamic Plot of Digital Financial Data Amidst Futuristic Displays
Premium
AI driven project management dashboard with Gantt chart, analytics, and data visualization tools. Ideal for business strategy, planning, productivity, timeline, KPI and performance tracking.
Abstract Data Analytics with Technology Interface Overlay
Digital Graphs and Covid-19 Cells on Virtual Interface with Cars
Global Financial Market Analysis with Digital Charts and Data
Futuristic Digital Matrix with Moving Data Streams
Premium
Abstract geometric shapes and data points on a clean, flat background depicting market analysis, abstract background, background
Digital Data Interface Over Modern Server Room Environment
Digital Data Interface Over Cityscape with Global Business Theme
Digital Threat Landscape with Cybersecurity Concepts Over Cityscape
Futuristic Infographic Interface with Data Analytics and AI Elements
Premium
A business professional analyzing futuristic digital graphs and analytics dashboards on a tablet, showcasing data visualization, financial growth, and business intelligence in a modern tech environmen
Futuristic Data Center with Streaming Light Streaks Downs Aisle
Global Cybersecurity Threat Highlighted by Digital Padlock Graphics
Futuristic Financial Data Dashboard with Analytics Charts
3D Code Blocks with Neon Circuit Traces in Digital Cyberspace
Premium
Two people interact with AI and data visualizations in a futuristic digital work setting.
Digital Charts Projected on Trees Symbolizing Eco-Friendly Analytics
Futuristic Data Visualization of Rising Analytics Bar Chart
Couple Overlooking Ocean at Dusk with Data Visualization Overlay
Futuristic 3D Data Visualization and Binary Digital Interface
Global Financial Growth Concept with Graph Arrows and Data Stats
Digital Interface with Dynamic Data Charts on Blue Background
Premium
Hovering wireframe keyboard in purple analytics space, with data sheets and binary sequences
UK Flag Integrates with Global Business and Data Analytics
Global Financial Data Overlay on Power Grid and Scenic Horizon
Futuristic Data Interface Over Cityscape Skyline
Digital Financial Charts Amid Mathematical Equations
Premium
Holographic shield cracking with red particle alerts, blue cyber grid background, AI threat defense interface
Digital Data Analysis with Statistical Charts on Grid Background
Futuristic Business Technology with Digital Graph Interface
Digital Financial Analytics with Declining Graph Display
Digital Business Graphs Overlaid on Futuristic Building Background
Premium
Marketer using digital marketing dashboard with charts, pie graphs, organization chart, and performance data. Concept of business analytics and strategic planning.
Futuristic Microprocessor and Circuit Board Background
Futuristic Network Interface Displaying Digital Connections
Data Analytics and Financial Trends in Urban Environment
Rising Financial Graph with Digital Interface Elements
Premium
Develop analytical thinking by learning to read, question, and apply data responsibly to enhance outcomes across all business areas.
Digital Financial Data Overlay on Urban Skyline Conceptual Imagery
Advanced Data Processing and Global Interface Concept
Futuristic HUD Interface with Scanning and Data Analysis
Futuristic Urban Skyline Overlayed with Data Graphics
Premium
Global financial trading chart with glowing blue bars and world map on digital interface background illustrating business data and economy concept. Ai generative
Cybersecurity Dashboard with Alert Notifications and Data Trends
Futuristic Interface with Data Graphs and HUD Elements
Glowing Circuit Board with Neon Blue Traces and Waveforms
Futuristic Data Visualization Over Urban Skyline at Dusk
Premium
A person interacts with futuristic digital data visualizations displaying colorful graphs and analytics in a dark, tech-focused environment.
Growing Bar and Line Graph with Red Arrow on Cloudy Sky Background
Advanced Data Analytics in Virtual Environment
Digital Data Overlay with Charts Over Urban Construction Site
Dynamic Financial Growth with Digital Analytics Data
Data Analytics Interface Displaying Various Graphs and Diagrams
Digital Analytics Overlay on American Flag and Sky
Premium
Industrial analytics smart factory manufacturing production line dashboard machine learning data visualization predictive maintenance quality control efficiency
Abstract Global Financial Data Overlay on World Map
Digital Data Analytics Framework Over Urban Cityscape
Futuristic Financial Analytics and Education Background
Digital Interface Displaying Economic Impact of Pandemic
Premium
Rising financial graph with glowing data lines showing market growth trends
Global Data Analytics and QR Code Interface Concept
Abstract Financial Data and Graphs on Dark Background
Abstract Data Processing with Digital Graph Elements
Futuristic Digital Interface with Data Graphics Overlay Concept
Premium
Businessman touching digital interface with customer analytics and data dashboard, representing CRM, AI targeting, data driven marketing, customer segmentation and intelligent business insights
Digital Interface with Floating Data Points and Charts on Dark Background
Rising Financial Graphs with Digital Stats and World Connectivity
Abstract Digital Interface with Data Visualization and Light Patterns
Conceptual Data Integration with Digital Network Connections
Premium
Cyber Hub: Display of data analysis on multiple monitors. A futuristic office workspace. The image represents technological process.
Data Visualization in Digital Finance Technology
Dynamic Digital Interface with Binary Coding and Data
City Skyline with Transparent Stock Market Data Overlaid
Futuristic Financial Dashboard with Graphs and Code
Premium
Digital organization chart with team structure, gender distribution pie chart, and colorful data graphs floating over laptop. Concept of business analytics and HR management.
Financial Charts Overlaid on a Greenhouse Symbolizing Growth and Innovation
Doctor Integrating Data Analytics in Healthcare Environment
Female Data Analyst Analyzing Financial Charts in Modern Office
Abstract Financial Data with Line Graph and Bars
Premium
Modern dashboard real time data tax compliance analytics business intelligence financial report digital interface technology office professional workspace
Clinician Analyzing Digital Healthcare Data with Tablet and Stethoscope
Sunset horizon glowing over rural landscape overlaying financial charts and timeline data
Business Growth and Financial Data Concepts
Digital Financial Data Over Cityscape
Data Processing Against American Flag and Cloudscape
China Flag and Data Processing Overlay on Urban Skyline
Premium
A smartphone platform displaying analytics with a miniature digital globe, representing mobile data intelligence and the concept of real time insights for global markets and connected devices.
Global Financial Data Networks Over Urban Cityscape
Abstract Financial and Mathematical Analysis Concept
3D Rendered Financial Graph on Digital Interface Background
Global Data Analysis Over World Map with Digital Interface
Premium
Close-up of a digital display showing various charts and graphs in blue and orange hues, representing data analysis and business intelligence, ideal for technology or financial concepts
Digital Representation of Statistical Data Analysis in Blue Hues
Global Data Visualization with Overlayed World Map
Digitally-Generated Data Processing on Computer Server Background
Digital Data Streams with Secure Processing Networks
Premium
Holographic business dashboard displaying pie chart and bar graph with futuristic blue and orange data visualization
Worker Analyzing Construction Site with Digital Data Overlay
Digital Analytics with Abstract Cityscape Background
Abstract Digital Data Display with Graphs and Charts
Abstract Global Network with Data Processing Symbols
Premium
business professional interacting with AI-driven KPI dashboards and data analytics visuals, showcasing modern performance metrics, digital insights, and advanced business intelligence technology.
Digital Interfaces Overlaying Businessman in Virtual Environment
Holographic Data Panel with Bar Chart in Digital Space
Urban Financial Center with Data Visualization and Stock Market Analytics
Paraguay Flag Overlay with Economic Data Visualization Themes
Premium
A green energy dashboard showcases innovative data visualization techniques. The interactive display highlights statistics related to sustainability, efficiency, and environmental impact. Cipher
Futuristic Hologram Panels Above Vibrant Night City
Modern Data Visualization with Bar Charts and Line Graphs
Abstract Data Visualization Over Ocean Dusk Scene
Abstract Financial Data Graphics with Modern Bar and Line Charts
Premium
Man using smartphone and laptop to interact with AI assistant chatbot for data analysis. Concept of artificial intelligence, big data, analytics, business insight, and smart technology integration.
Financial Data Overlay Merging Gold Bar Charts with Urban Skyline and Glass Facades