- Home >
- Stock Photos >
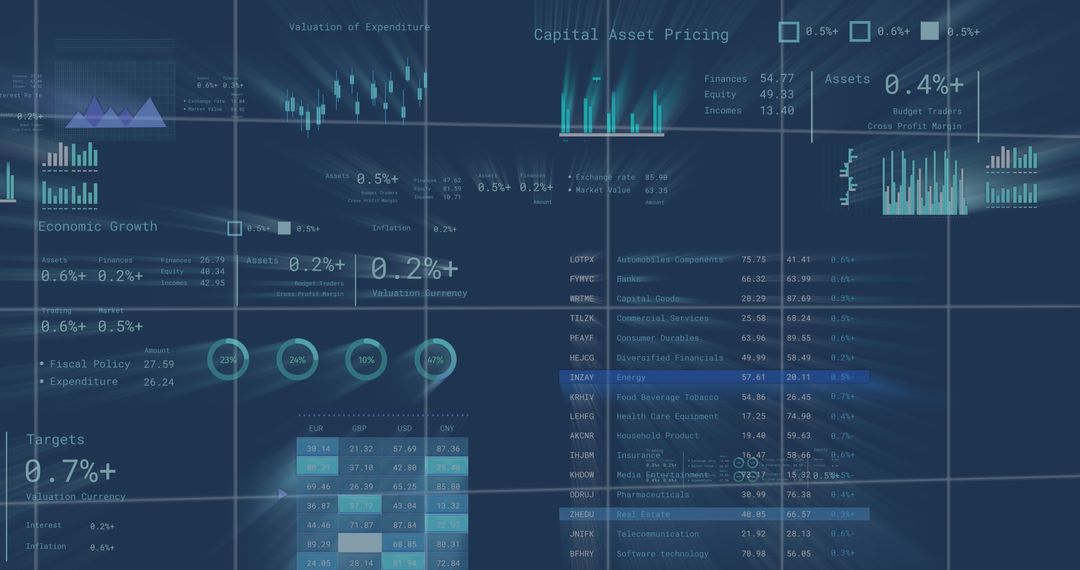
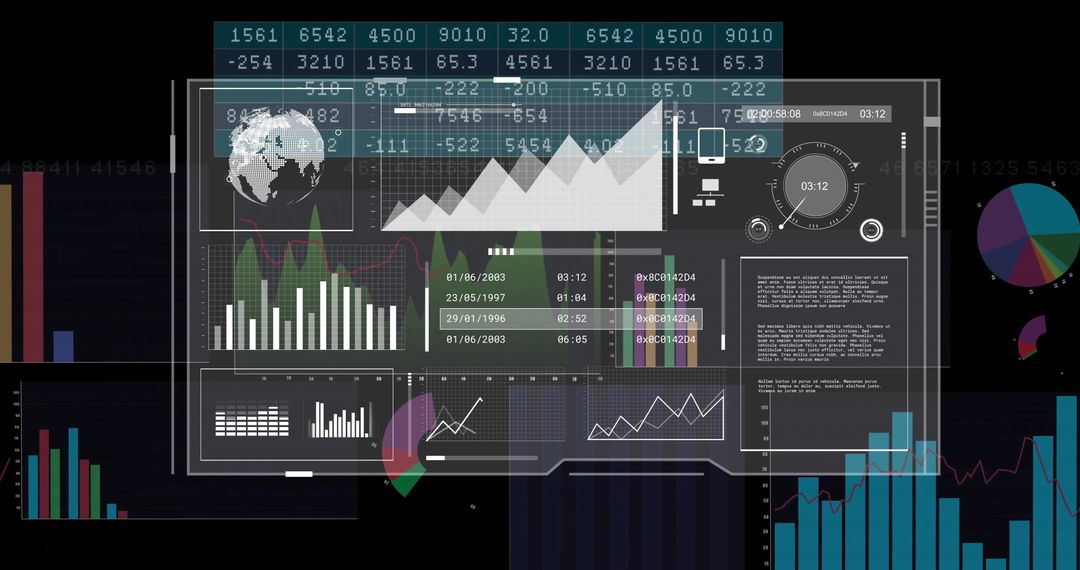
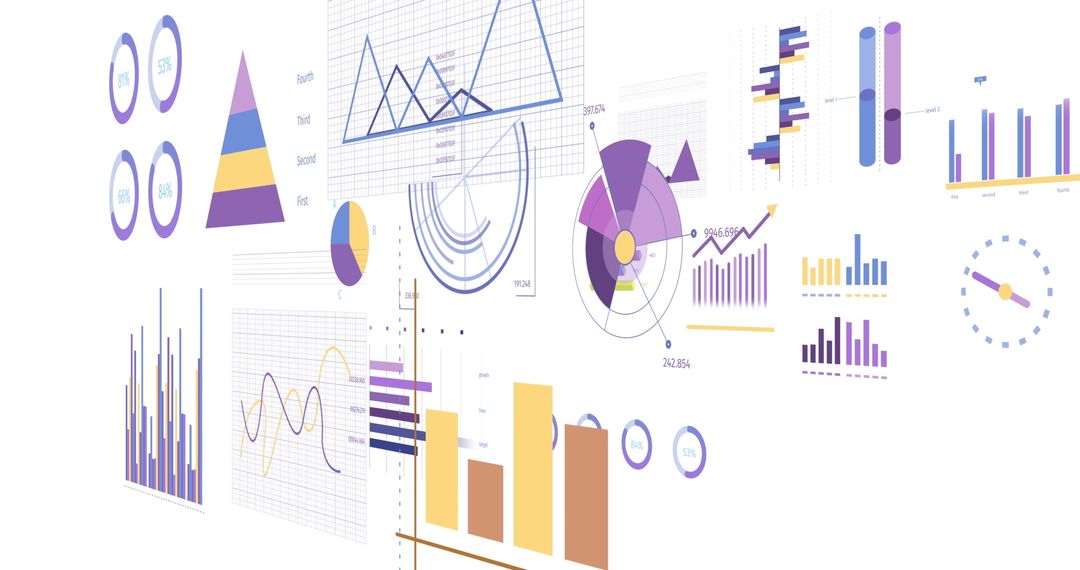
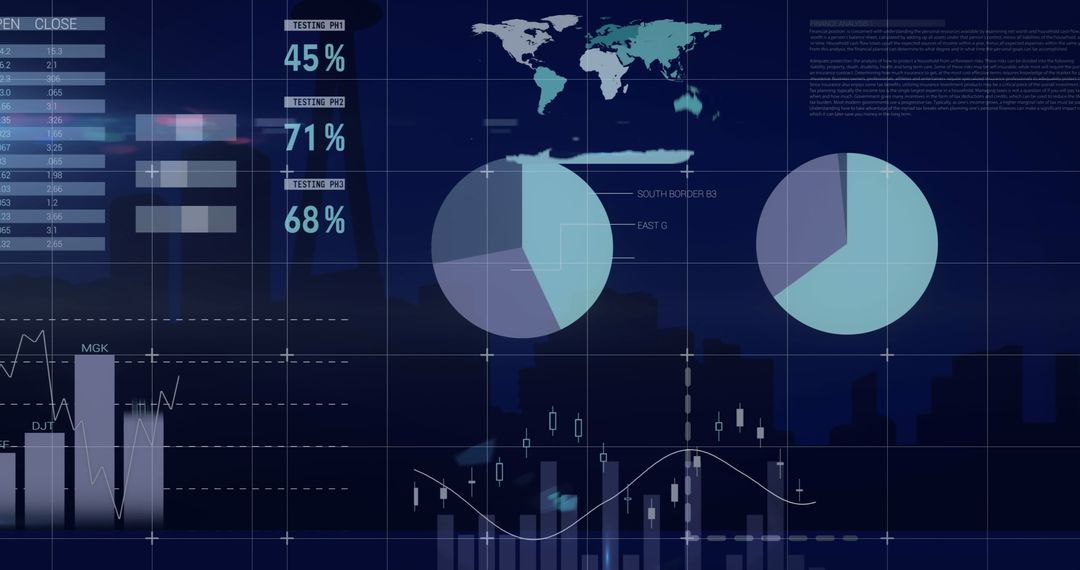
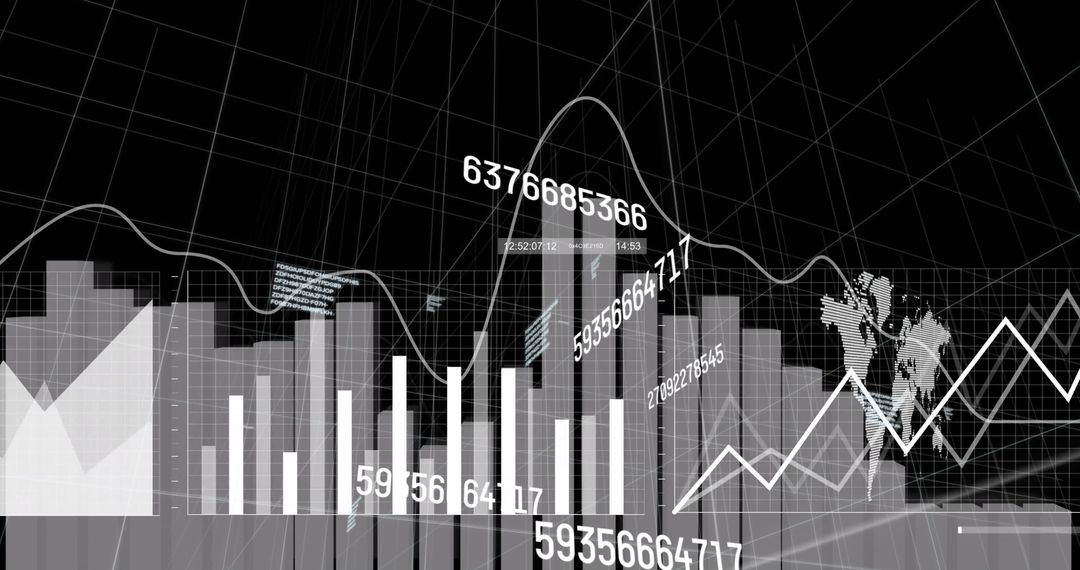
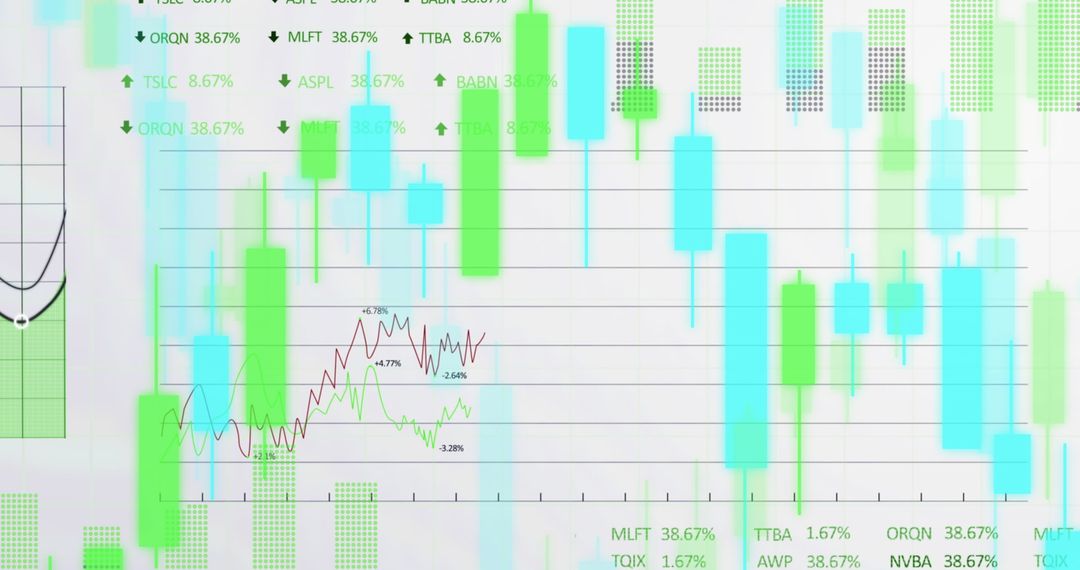
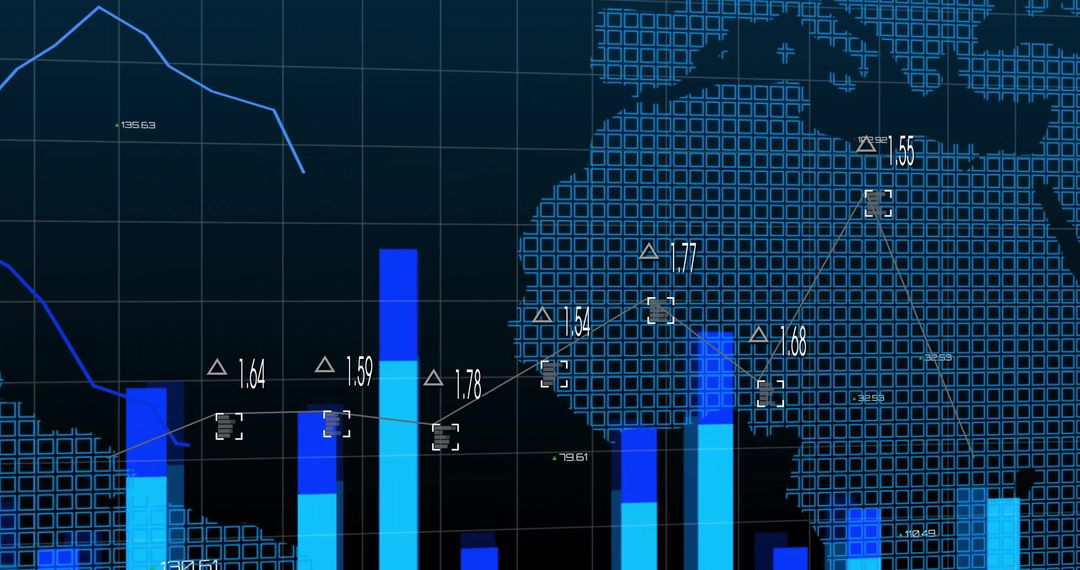
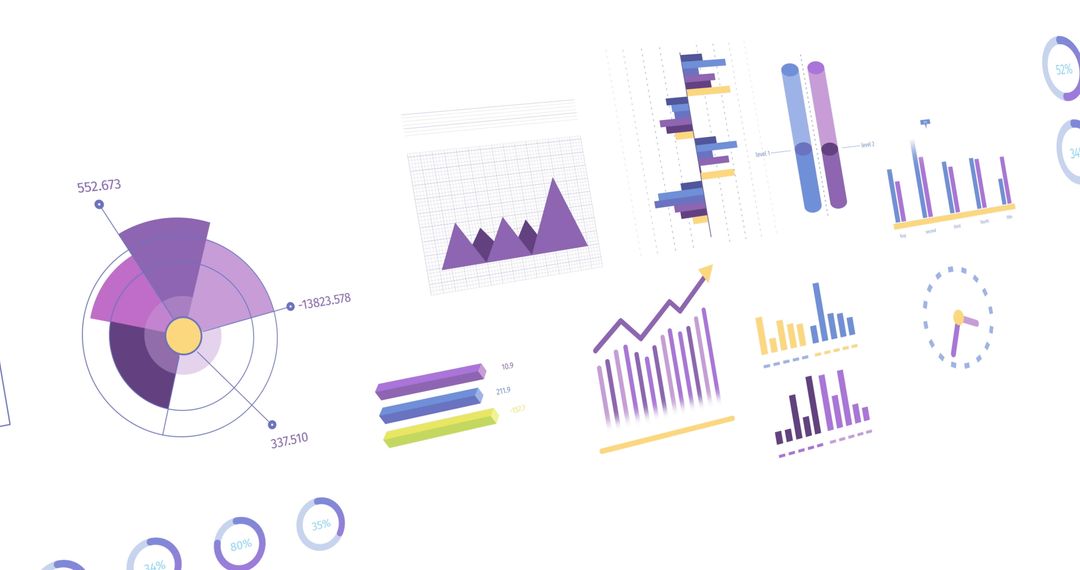
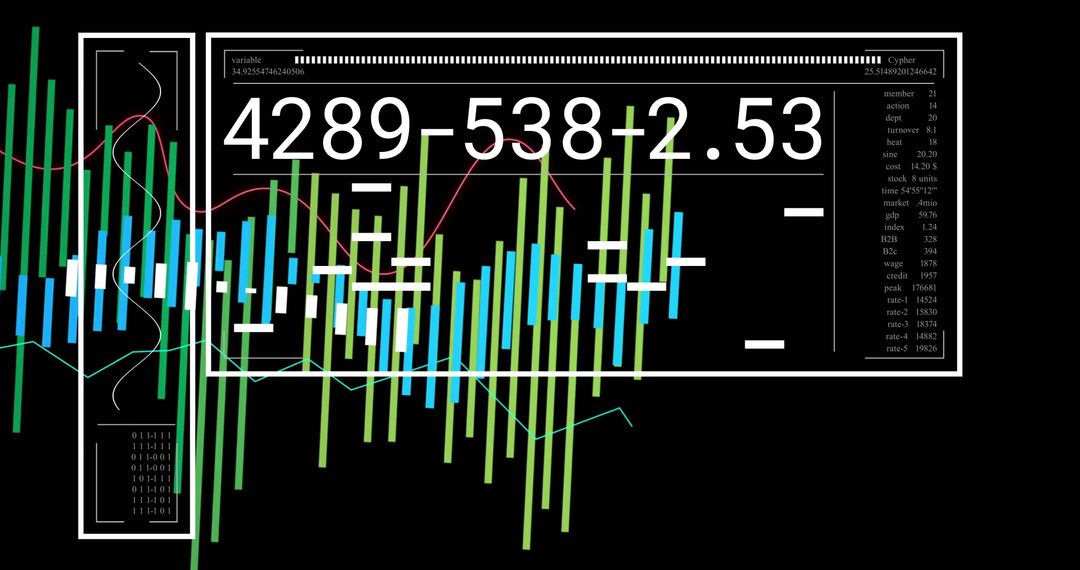
- Futuristic Data Analytics Dashboard with Colorful Bar Chart in 3D Grid
Futuristic Data Analytics Dashboard with Colorful Bar Chart in 3D Grid Image

This design with a colorful bar chart and numeric labels displayed in a futuristic 3D grid is ideal for any technology and analytics-oriented presentation. Perfect for use in promotional materials for data visualization software, digital consulting agencies, or educational uses in explaining how data analytics works. The blending of a visually compelling style with deep data concepts makes it ripe for presentations emphasizing innovation, technology-driven solutions, or attractive infographics, particularly for individuals interested in modern data manipulation tools.
Powered by  - Get 15% off with code: PIKWIZARD15


2
downloads
downloads
Tags:
More
Credit Photo
If you would like to credit the Photo, here are some ways you can do so
Text Link
photo Link
<span class="text-link">
<span>
<a target="_blank" href=https://pikwizard.com/photo/futuristic-data-analytics-dashboard-with-colorful-bar-chart-in-3d-grid/7943cb38d0283b9b9439941728c325cf/>PikWizard</a>
</span>
</span>
<span class="image-link">
<span
style="margin: 0 0 20px 0; display: inline-block; vertical-align: middle; width: 100%;"
>
<a
target="_blank"
href="https://pikwizard.com/photo/futuristic-data-analytics-dashboard-with-colorful-bar-chart-in-3d-grid/7943cb38d0283b9b9439941728c325cf/"
style="text-decoration: none; font-size: 10px; margin: 0;"
>
<img src="https://pikwizard.com/pw/medium/7943cb38d0283b9b9439941728c325cf.jpg" style="margin: 0; width: 100%;" alt="" />
<p style="font-size: 12px; margin: 0;">PikWizard</p>
</a>
</span>
</span>
Free (free of charge)
Free for personal and commercial use.
Author: Authentic Images
Similar Free Stock Images

Premium


Premium


Premium


Premium


Premium


Premium


Premium


Premium


Premium


Premium


Premium


Premium


Premium


Premium


Premium


Premium


Premium


Premium


Premium


Premium


Premium


Premium


Premium


Premium