
- Home >
- Stock Photos >
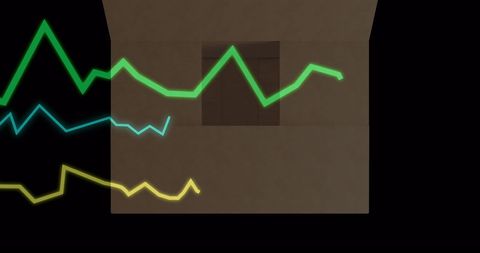
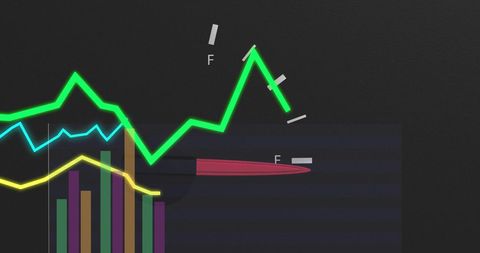
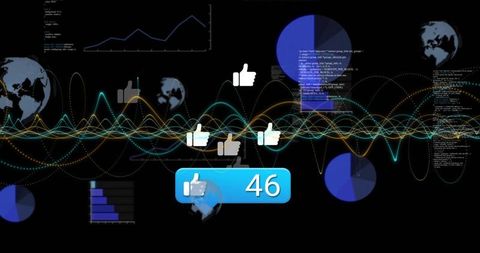
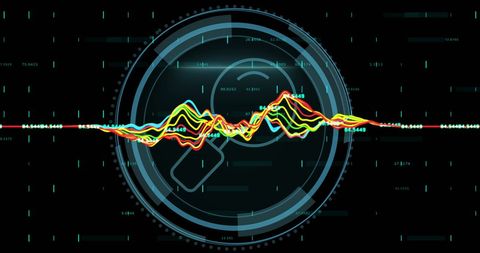
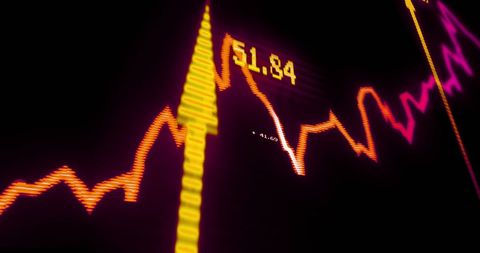
- Futuristic Data Analytics Dashboard with Neon Graphs
Futuristic Data Analytics Dashboard with Neon Graphs Image
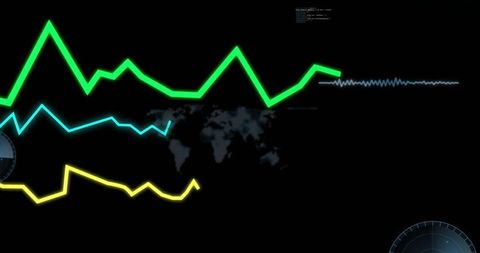
Vibrant neon line graphs interact with a high-tech interface, layered over a subtle world map, visualizing complex data on a sleek dashboard. Radar-like elements and a digital code snippet enhance the technological feel. Ideal for use in articles, presentations, and projects related to data analytics, tech innovation, and futuristic design concepts. Visualization showcases dynamics of data-driven decision environments.
Powered by 


downloads
Tags:
More
Credit Photo
If you would like to credit the Photo, here are some ways you can do so
Text Link
photo Link
<span class="text-link">
<span>
<a target="_blank" href=https://pikwizard.com/photo/futuristic-data-analytics-dashboard-with-neon-graphs/5301e893fea7f8aa058036b05358ed5d/>PikWizard</a>
</span>
</span>
<span class="image-link">
<span
style="margin: 0 0 20px 0; display: inline-block; vertical-align: middle; width: 100%;"
>
<a
target="_blank"
href="https://pikwizard.com/photo/futuristic-data-analytics-dashboard-with-neon-graphs/5301e893fea7f8aa058036b05358ed5d/"
style="text-decoration: none; font-size: 10px; margin: 0;"
>
<img src="https://pikwizard.com/pw/medium/5301e893fea7f8aa058036b05358ed5d.jpg" style="margin: 0; width: 100%;" alt="" />
<p style="font-size: 12px; margin: 0;">PikWizard</p>
</a>
</span>
</span>
Free (free of charge)
Free for personal and commercial use.
Author: People Creations
Similar Free Stock Images

Premium

Premium


Premium


Premium


Premium


Premium


Premium

Premium


Premium


Premium


Premium


Premium


Premium

Premium


Premium


Premium


Premium


Premium


Premium


Premium

Premium

Premium


Premium


Premium


Premium


Explore More Free Stock Images