- Home >
- Stock Photos >
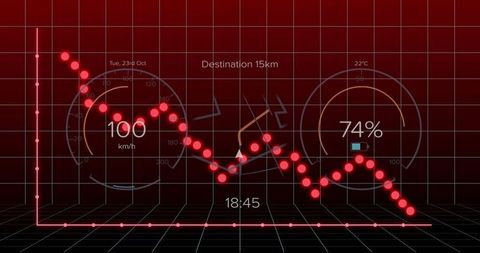
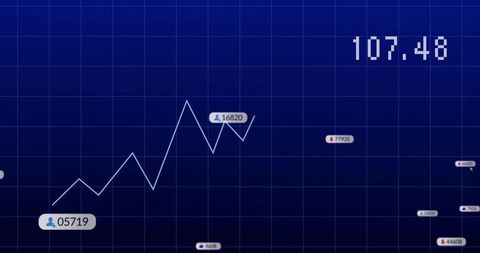
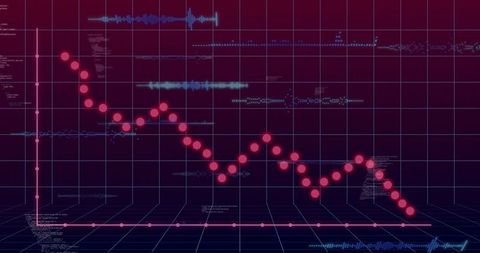
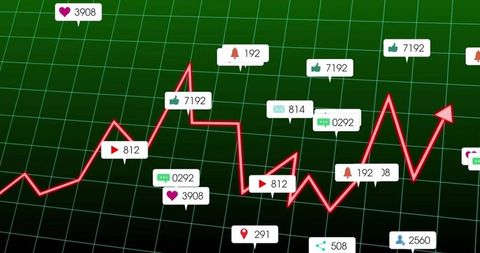
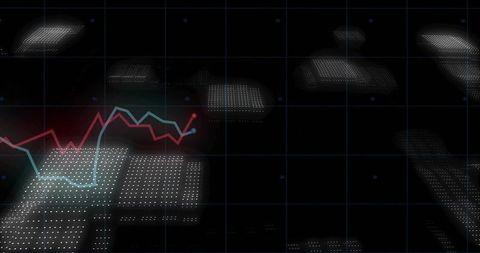
- Futuristic Data Analytics Dashboard with Neon Line Graph
Futuristic Data Analytics Dashboard with Neon Line Graph Image

Advanced technology themed image suitable for showcasing data science projects, financial forecasts, technology innovations, or digital marketing strategies. The glowing neon pink line graph against a dark grid highlights progress and trends. Perfect for presentations, professional reports, blogs focusing on analytics and tech insights.

downloads
Tags:
More
Credit Photo
If you would like to credit the Photo, here are some ways you can do so
Text Link
photo Link
<span class="text-link">
<span>
<a target="_blank" href=https://pikwizard.com/photo/futuristic-data-analytics-dashboard-with-neon-line-graph/02a609f3edd3e29e9b5b6334a1271628/>PikWizard</a>
</span>
</span>
<span class="image-link">
<span
style="margin: 0 0 20px 0; display: inline-block; vertical-align: middle; width: 100%;"
>
<a
target="_blank"
href="https://pikwizard.com/photo/futuristic-data-analytics-dashboard-with-neon-line-graph/02a609f3edd3e29e9b5b6334a1271628/"
style="text-decoration: none; font-size: 10px; margin: 0;"
>
<img src="https://pikwizard.com/pw/medium/02a609f3edd3e29e9b5b6334a1271628.jpg" style="margin: 0; width: 100%;" alt="" />
<p style="font-size: 12px; margin: 0;">PikWizard</p>
</a>
</span>
</span>
Free (free of charge)
Free for personal and commercial use.
Author: Creative Art