
- Home >
- Stock Photos >
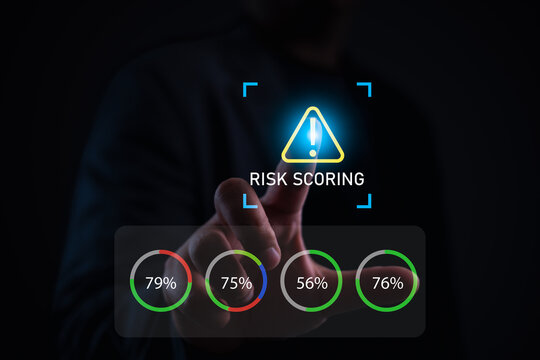
- Futuristic Data Analytics Dashboard with Security Icon
Futuristic Data Analytics Dashboard with Security Icon Image

This illustration presents a digital dashboard with a focus on data analytics and cybersecurity. Featuring red and blue line charts, it showcases complex data structures viewed through grid overlays. The circular icon with a monitor suggests elements of protection, hinting at cybersecurity measures. Useful for publications related to technology development, finance sector analytics, or digital security presentations.
Powered by 


downloads
Tags:
More
Credit Photo
If you would like to credit the Photo, here are some ways you can do so
Text Link
photo Link
<span class="text-link">
<span>
<a target="_blank" href=https://pikwizard.com/photo/futuristic-data-analytics-dashboard-with-security-icon/0d06df58d808274a4b2220a657727c85/>PikWizard</a>
</span>
</span>
<span class="image-link">
<span
style="margin: 0 0 20px 0; display: inline-block; vertical-align: middle; width: 100%;"
>
<a
target="_blank"
href="https://pikwizard.com/photo/futuristic-data-analytics-dashboard-with-security-icon/0d06df58d808274a4b2220a657727c85/"
style="text-decoration: none; font-size: 10px; margin: 0;"
>
<img src="https://pikwizard.com/pw/medium/0d06df58d808274a4b2220a657727c85.jpg" style="margin: 0; width: 100%;" alt="" />
<p style="font-size: 12px; margin: 0;">PikWizard</p>
</a>
</span>
</span>
Free (free of charge)
Free for personal and commercial use.
Author: People Creations