
- Home >
- Stock Photos >
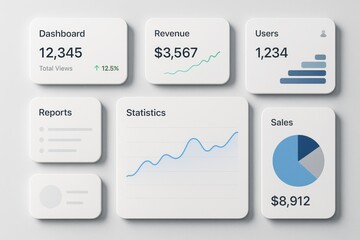
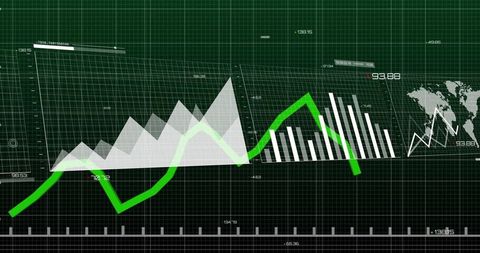
- Futuristic Data Analytics Dashboard with Virus Icons
Futuristic Data Analytics Dashboard with Virus Icons Image

This visual representation showcases an advanced analytics dashboard with charts, graphs, and virus icons. Useful for illustrating data-driven technology, innovative solutions in data management, or highlighting contemporary issues such as network security or public health challenges. Ideal for articles, presentations, and educational materials relating to cutting-edge technological developments and data analysis.
Powered by 


downloads
Tags:
More
Credit Photo
If you would like to credit the Photo, here are some ways you can do so
Text Link
photo Link
<span class="text-link">
<span>
<a target="_blank" href=https://pikwizard.com/photo/futuristic-data-analytics-dashboard-with-virus-icons/ae3fb86a49e5424d51ec84070b4ed809/>PikWizard</a>
</span>
</span>
<span class="image-link">
<span
style="margin: 0 0 20px 0; display: inline-block; vertical-align: middle; width: 100%;"
>
<a
target="_blank"
href="https://pikwizard.com/photo/futuristic-data-analytics-dashboard-with-virus-icons/ae3fb86a49e5424d51ec84070b4ed809/"
style="text-decoration: none; font-size: 10px; margin: 0;"
>
<img src="https://pikwizard.com/pw/medium/ae3fb86a49e5424d51ec84070b4ed809.jpg" style="margin: 0; width: 100%;" alt="" />
<p style="font-size: 12px; margin: 0;">PikWizard</p>
</a>
</span>
</span>
Free (free of charge)
Free for personal and commercial use.
Author: People Creations
Similar Free Stock Images

Premium


Premium


Premium


Premium
Premium

Premium


Premium


Premium


Premium


Premium

Premium


Premium


Premium


Premium


Premium


Premium

Premium


Premium


Premium


Premium


Premium


Premium


Premium


Premium


Premium


Explore More Free Stock Images