
- Home >
- Stock Photos >
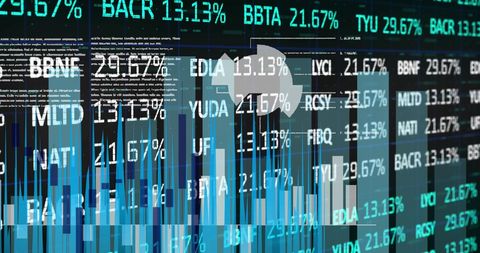
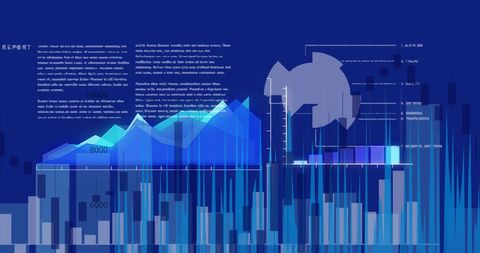
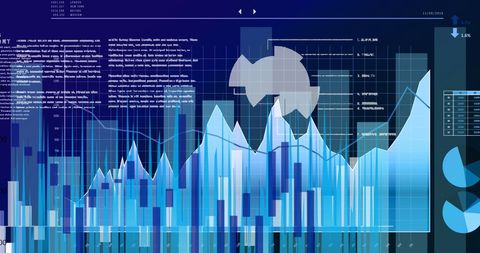
- Futuristic Data Analytics Display with Global Ledger
Futuristic Data Analytics Display with Global Ledger Image

This image depicts a digital interface highlighting data processing and statistics, communicating the concept of cutting-edge technology in global networking and financial analyses. Useful for illustrating topics in finance, technology advancements, data science, and economic reporting in websites, presentations, and marketing materials.
Powered by 


downloads
Tags:
More
Credit Photo
If you would like to credit the Photo, here are some ways you can do so
Text Link
photo Link
<span class="text-link">
<span>
<a target="_blank" href=https://pikwizard.com/photo/futuristic-data-analytics-display-with-global-ledger/57b68bb299a1480a3e59914029ab77dc/>PikWizard</a>
</span>
</span>
<span class="image-link">
<span
style="margin: 0 0 20px 0; display: inline-block; vertical-align: middle; width: 100%;"
>
<a
target="_blank"
href="https://pikwizard.com/photo/futuristic-data-analytics-display-with-global-ledger/57b68bb299a1480a3e59914029ab77dc/"
style="text-decoration: none; font-size: 10px; margin: 0;"
>
<img src="https://pikwizard.com/pw/medium/57b68bb299a1480a3e59914029ab77dc.jpg" style="margin: 0; width: 100%;" alt="" />
<p style="font-size: 12px; margin: 0;">PikWizard</p>
</a>
</span>
</span>
Free (free of charge)
Free for personal and commercial use.
Author: Authentic Images
Similar Free Stock Images

Premium


Premium


Premium


Premium


Premium


Premium


Premium

Premium

Premium


Premium


Premium


Premium

Premium


Premium


Premium

Premium


Premium


Premium


Premium


Premium


Premium


Premium


Premium


Premium


Premium

Explore More Free Stock Images