
- Home >
- Stock Photos >
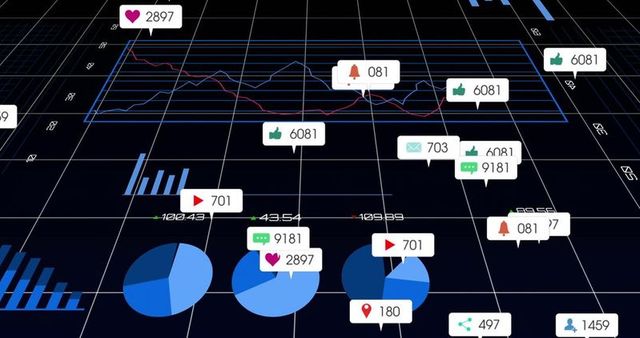
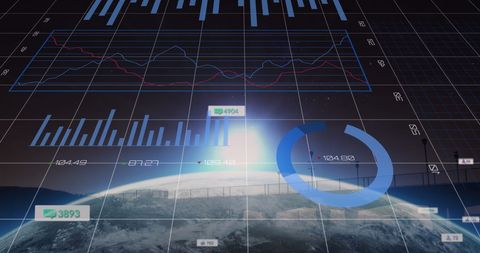
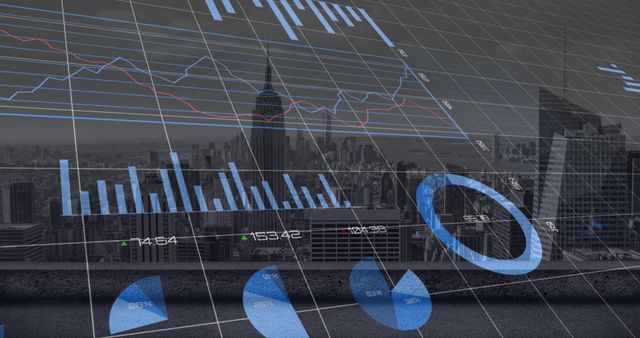
- Futuristic Data Analytics Display with Interactive Graphs and Charts
Futuristic Data Analytics Display with Interactive Graphs and Charts Image
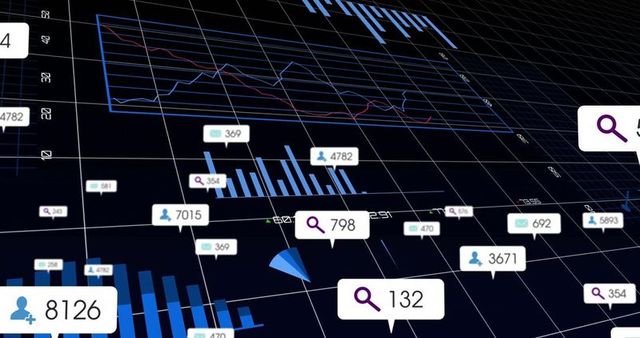
Design emphasizes modern digital analysis showcasing interactive 3D graphs and icons. Highlights attributes include sophisticated data monitoring through visually engaging interface. Perfect for illustrating cutting-edge technology, financial reporting, trend analysis, business intelligence, or digital marketing insights.
Powered by 


downloads
Tags:
More
Credit Photo
If you would like to credit the Photo, here are some ways you can do so
Text Link
photo Link
<span class="text-link">
<span>
<a target="_blank" href=https://pikwizard.com/photo/futuristic-data-analytics-display-with-interactive-graphs-and-charts/d4655f19eb9a6a3530c19a85ba257c11/>PikWizard</a>
</span>
</span>
<span class="image-link">
<span
style="margin: 0 0 20px 0; display: inline-block; vertical-align: middle; width: 100%;"
>
<a
target="_blank"
href="https://pikwizard.com/photo/futuristic-data-analytics-display-with-interactive-graphs-and-charts/d4655f19eb9a6a3530c19a85ba257c11/"
style="text-decoration: none; font-size: 10px; margin: 0;"
>
<img src="https://pikwizard.com/pw/medium/d4655f19eb9a6a3530c19a85ba257c11.jpg" style="margin: 0; width: 100%;" alt="" />
<p style="font-size: 12px; margin: 0;">PikWizard</p>
</a>
</span>
</span>
Free (free of charge)
Free for personal and commercial use.
Author: People Creations
Similar Free Stock Images

Premium


Premium

Premium

Premium


Premium

Premium


Premium


Premium


Premium


Premium


Premium


Premium


Premium


Premium


Premium


Premium


Premium

Premium


Premium


Premium


Premium


Premium


Premium


Premium


Premium


Explore More Free Stock Images