
- Home >
- Stock Photos >
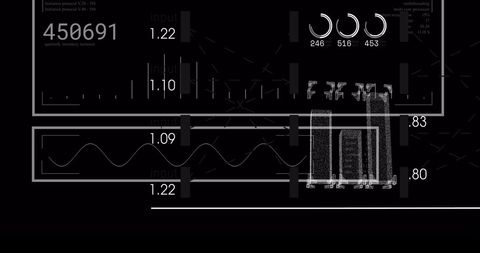
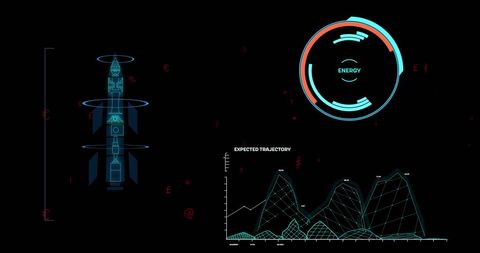
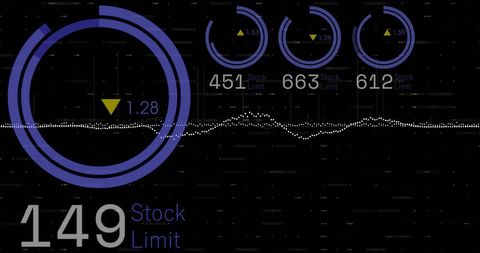
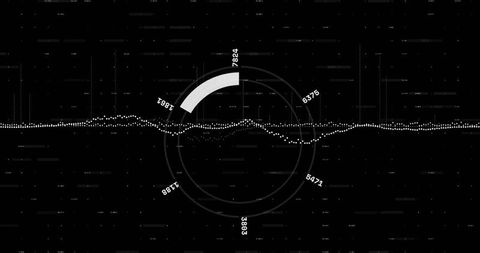
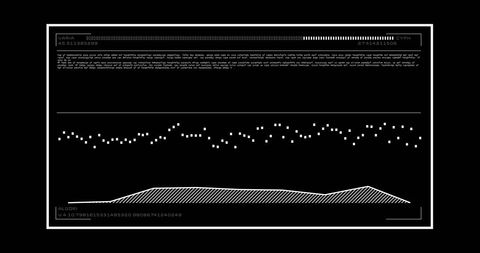
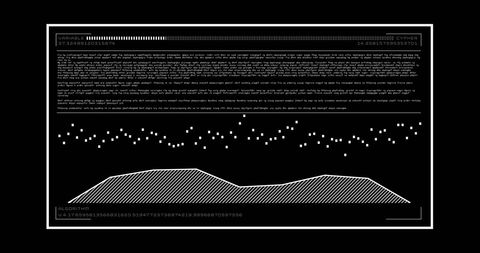
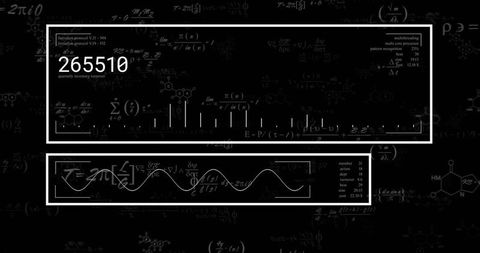
- Futuristic Data Analytics Display with Numeric and Graphical Metrics
Futuristic Data Analytics Display with Numeric and Graphical Metrics Image
Ideal for presentations, tech interfaces, or illustrating advanced analytics concepts. Useful in conveying the sophistication and style of modern dashboards.
Powered by 


downloads
Tags:
More
Credit Photo
If you would like to credit the Photo, here are some ways you can do so
Text Link
photo Link
<span class="text-link">
<span>
<a target="_blank" href=https://pikwizard.com/photo/futuristic-data-analytics-display-with-numeric-and-graphical-metrics/e8ea893c683d1397767bcb2bdf45423f/>PikWizard</a>
</span>
</span>
<span class="image-link">
<span
style="margin: 0 0 20px 0; display: inline-block; vertical-align: middle; width: 100%;"
>
<a
target="_blank"
href="https://pikwizard.com/photo/futuristic-data-analytics-display-with-numeric-and-graphical-metrics/e8ea893c683d1397767bcb2bdf45423f/"
style="text-decoration: none; font-size: 10px; margin: 0;"
>
<img src="https://pikwizard.com/pw/medium/e8ea893c683d1397767bcb2bdf45423f.jpg" style="margin: 0; width: 100%;" alt="" />
<p style="font-size: 12px; margin: 0;">PikWizard</p>
</a>
</span>
</span>
Free (free of charge)
Free for personal and commercial use.
Author: Awesome Content
Similar Free Stock Images

Premium


Premium


Premium


Premium


Premium


Premium


Premium


Premium


Premium


Premium


Premium


Premium

Premium


Premium


Premium

Premium


Premium


Premium


Premium


Premium


Premium


Premium

Premium


Premium


Premium


Explore More Free Stock Images