
- Home >
- Stock Photos >
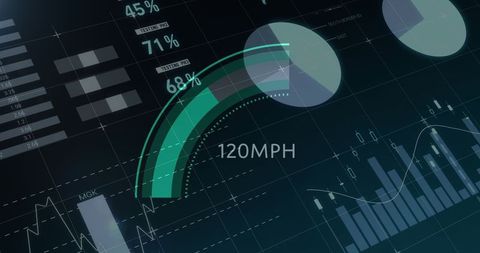
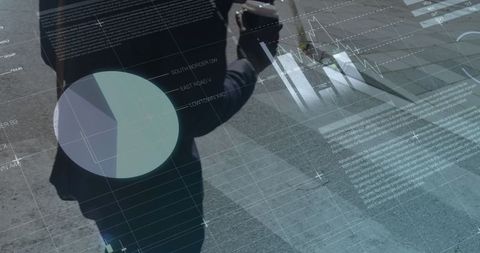
- Futuristic Data Analytics Interface with Glowing Graphs and Charts
Futuristic Data Analytics Interface with Glowing Graphs and Charts Image

Futuristic digital interface showcasing business analytical data with glowing, pulsating shapes serves sectors in technology and finance. Features dynamic graphs, pie charts, and statistical patterns. Useful for presentations in data science education, representations of advanced software, AI development concepts, or financial technology services development advertisements.
Powered by 


downloads
Tags:
More
Credit Photo
If you would like to credit the Photo, here are some ways you can do so
Text Link
photo Link
<span class="text-link">
<span>
<a target="_blank" href=https://pikwizard.com/photo/futuristic-data-analytics-interface-with-glowing-graphs-and-charts/a020ca3fd780486fc703cf87a58516a3/>PikWizard</a>
</span>
</span>
<span class="image-link">
<span
style="margin: 0 0 20px 0; display: inline-block; vertical-align: middle; width: 100%;"
>
<a
target="_blank"
href="https://pikwizard.com/photo/futuristic-data-analytics-interface-with-glowing-graphs-and-charts/a020ca3fd780486fc703cf87a58516a3/"
style="text-decoration: none; font-size: 10px; margin: 0;"
>
<img src="https://pikwizard.com/pw/medium/a020ca3fd780486fc703cf87a58516a3.jpg" style="margin: 0; width: 100%;" alt="" />
<p style="font-size: 12px; margin: 0;">PikWizard</p>
</a>
</span>
</span>
Free (free of charge)
Free for personal and commercial use.
Author: People Creations
Similar Free Stock Images

Premium


Premium


Premium


Premium


Premium


Premium


Premium


Premium

Premium

Premium


Premium


Premium


Premium

Premium

Premium


Premium

Premium


Premium


Premium


Premium


Premium


Premium

Premium


Premium

Premium


Explore More Free Stock Images