
- Home >
- Stock Photos >
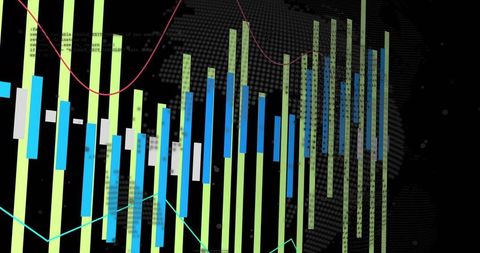
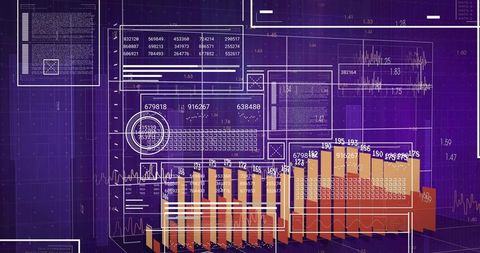
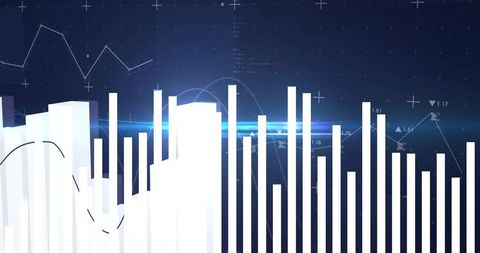
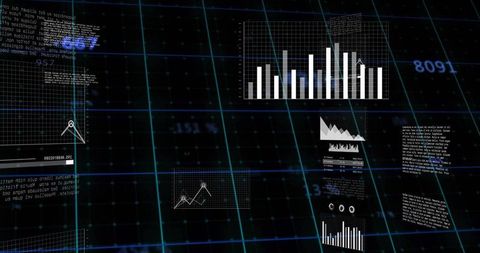
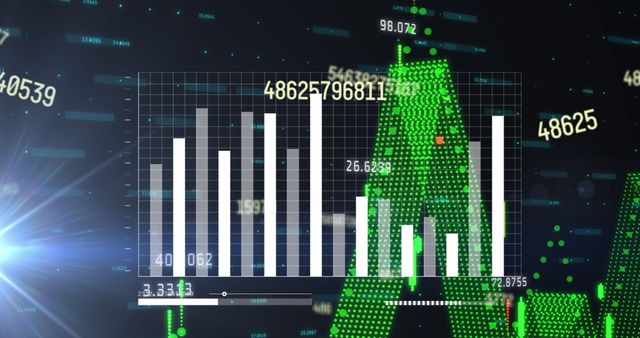
- Futuristic Data Analytics Processing on Digital Screen Background
Futuristic Data Analytics Processing on Digital Screen Background Image
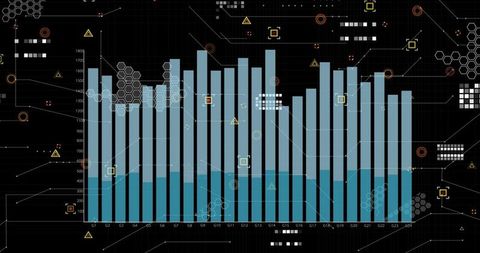
Image showcases a high-tech virtual interface with data bars and graphs on a digital screen. Futuristic elements like icons and hexagonal patterns emphasize advanced data analytics and processing themes. Suitable for illustrating concepts of technology, digital analysis, computer science, and tech news or educational materials.
Powered by 


downloads
Tags:
More
Credit Photo
If you would like to credit the Photo, here are some ways you can do so
Text Link
photo Link
<span class="text-link">
<span>
<a target="_blank" href=https://pikwizard.com/photo/futuristic-data-analytics-processing-on-digital-screen-background/66879a1570b394a4431683ab6344789e/>PikWizard</a>
</span>
</span>
<span class="image-link">
<span
style="margin: 0 0 20px 0; display: inline-block; vertical-align: middle; width: 100%;"
>
<a
target="_blank"
href="https://pikwizard.com/photo/futuristic-data-analytics-processing-on-digital-screen-background/66879a1570b394a4431683ab6344789e/"
style="text-decoration: none; font-size: 10px; margin: 0;"
>
<img src="https://pikwizard.com/pw/medium/66879a1570b394a4431683ab6344789e.jpg" style="margin: 0; width: 100%;" alt="" />
<p style="font-size: 12px; margin: 0;">PikWizard</p>
</a>
</span>
</span>
Free (free of charge)
Free for personal and commercial use.
Author: Awesome Content
Similar Free Stock Images

Premium


Premium

Premium


Premium


Premium

Premium

Premium


Premium

Premium


Premium
Premium

Premium


Premium


Premium


Premium


Premium


Premium


Premium
Premium


Premium

Premium


Premium


Premium


Premium


Premium

Explore More Free Stock Images