1. Home > 
  2. Stock Photos > 
  3. Futuristic Data Analytics Visualization in Neon Design

Futuristic Data Analytics Visualization in Neon Design Image

Futuristic Data Analytics Visualization in Neon Design

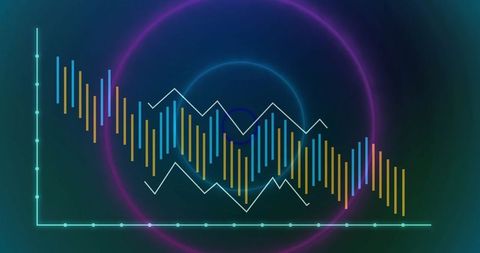
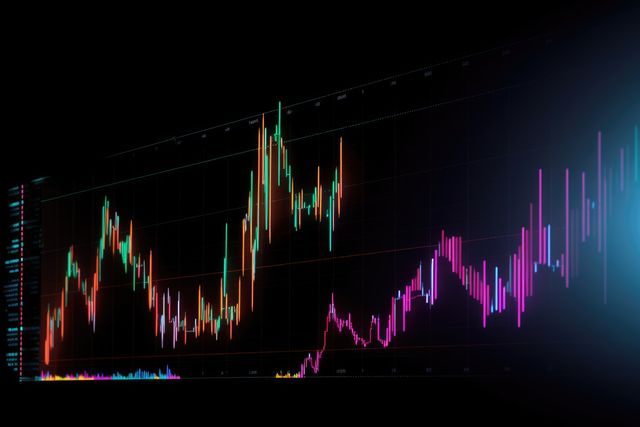
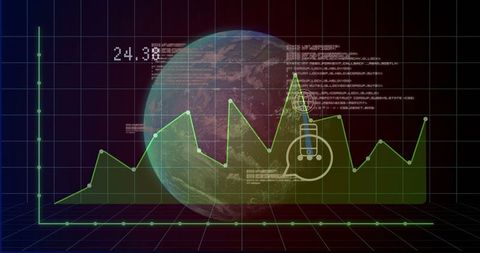
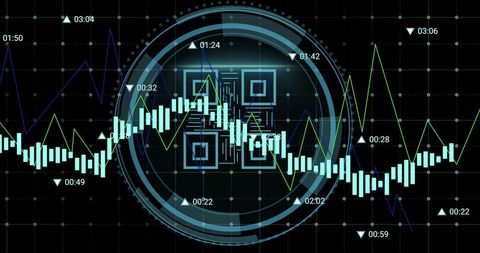
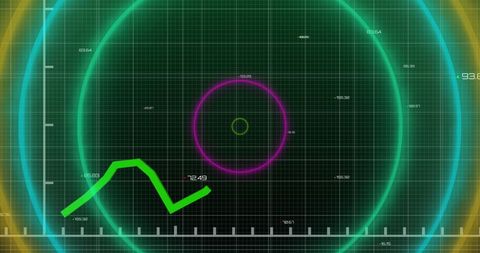
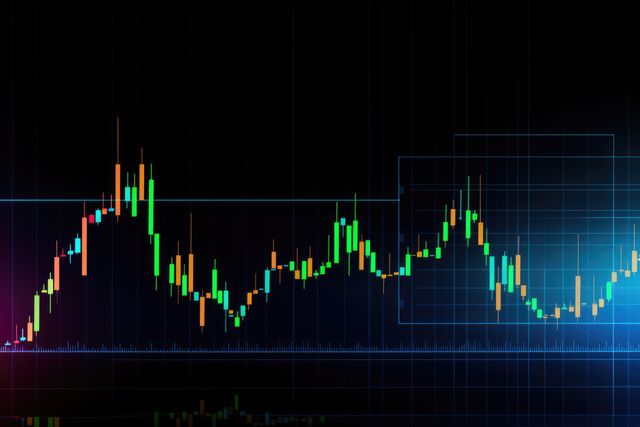
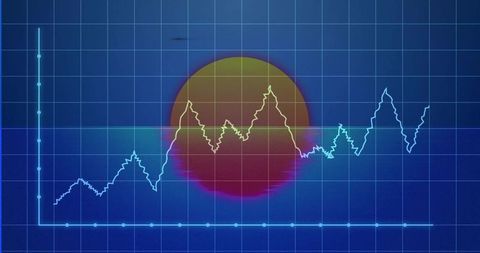
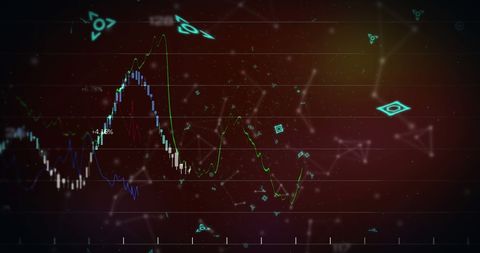
This vibrant and modern representation illustrates data trends with a descending bar chart and a striking white line graph across a dark neon-themed background. Cyan-colored axes and hypnotic neon rings enhance its futuristic appearance, making it ideal for presentations, reports on data analytics or any project involving technology and digital innovation. Perfect for conveying complex data in a visually appealing way.

Powered by Adobe logo
3d data visualization showing digital graph analytics chart with bright orange and blue lights on dark conference table in modern office - Powered by AdobeAbstract digital world map with glowing data points and graphical user interface elements displayed - Powered by AdobeAbstract colorful data visualization graph with smooth curves and markers on dark background for business analytics and digital design - Powered by Adobeconcept of artificial intelligence and data analysis, businessman demonstrates virtual interface of graph and holographic AI brain on hand, conveying future technology and intelligent work assistants - Powered by AdobeColorful digital data visualization with glowing vertical bars and lines in warm and cool tones representing abstract technology and data analysis - Powered by Adobe

Credit Photo

If you would like to credit the Photo, here are some ways you can do so

Free (free of charge)

Free for personal and commercial use.

Author: Awesome Content

Similar Free Stock Images

Dynamic Financial Growth Representing Business Trends
Premium
Business professional presenting data analysis
Data Visualization on Security Shield Interface for Cyber Security
Global Business Dashboard Overlay on Urban Skyline Background
Premium
Unlock your brain's potential with AI analytics for insightful data visualization and strategic decision-making, driving innovation and success in business
Digital Financial Graph with Tech Symbols on Red Background
Abstract Financial Graph Illustration on Dark Background
Neon Candlestick Trading Chart Visualizing Market Trends, Financial Data and Analytics
Futuristic Data Visualization with Dynamic Graphs and Digital Globe
Premium
The illustration shows a vibrant green arrow graph trending upwards against a dark background with bokeh effects and grid lines, suggesting growth or progress.
Abstract Digital Data Graph and Diagrams on Gray Background
Colorful Bar Graph with Data Overlay on Black Background
Dynamic Financial Data Visualization with Abstract Graph
Premium
Big data technology data science analysis artificial intelligence generative ai deep learning machine learning algorithm neural flow network analytics innovation abstract futuristic. 3d rendering.
Abstract Digital Chart on Black Background Representing Data Analysis
Dynamic Financial Data Visualization with Binary Code Overlay
AI
Colorful Financial Stock Chart on Dark Background
Financial Data Processing Visualization with Colorful Bar Charts
Premium
Stock market graph with blue technology background, financial trading analysis chart, investment growth data visualization, economic business concept
Premium
A vibrant, neon-themed graph showing growth, with colorful bars increasing in height, symbolizing progress and success in a dynamic visual style.
Financial Data Visualization Over Futuristic Cityscape
Dynamic Data Graphs Display on Dark Digital Background
Abstract Data Visualization with Dynamic Charts and Graphs
Abstract Financial Data Charts Reflecting Economic Trends
Premium
Digital abstract glowing blue bar graph and line chart showing financial growth and data analytics on a dark background
Data Security with Tech Bar Graph Overlay
Digital Financial Data Analysis with Graph and HUD Interface
Financial Data Analysis with Abstract Chart Grid Overlay
Futuristic Technology Analytics Interface on Dark Background
Digital Financial Graph with Dynamic Trading Analysis
Futuristic Digital Analytics Chart with Code Overlay
Dynamic Financial Data Visualization with 3D Graphs and Candlesticks
Financial Market Data Visualization with Line Graph and Candlesticks
Dynamic Financial Graph with Rising Stock Data
Dynamic Data Analytics Display with Multicolored Graph Lines
Digital Interface Concept with Data Circles and Graph
Analyzing Stock Market Trends with Candlestick Chart and Data Visualization
Premium
A robotic hand presents a glowing data visualization on a tablet, showcasing graphs and analytics against a dark urban skyline, symbolizing advanced technology integration. Scalp
Premium
Abstract visualization of glowing geometric data patterns on a dark atmospheric background.
Dynamic Stock Market Data on Digital Interface
Candlestick Chart Visualization with Indicators and Growth Highlight
Futuristic Global Business Data with Digital Interface
Innovative Stock Market Analysis Illustration with Digital Graphs
Analyzing Financial Data on Digital World Map Background
Dynamic Financial Data Against Urban Skyline
Abstract Financial Graph On Black Background Representing Data Analysis
Dynamic Data Graphs on Digital Interface Background
Premium
Neon data dashboard with glowing blue, pink and purple panels, central circular gauge, side lists and a line graph on a dark background — futuristic analytics UI.
Global Financial Network and Stock Market Analytics
Futuristic Analytics Graph with Cyan-Orange Line Trends
Conceptual Financial Data and Scope Scanning Over Grid Background
Digital Finance: Holographic Trading and Tech Visualization
Premium
Abstract digital data analytics visualization in pink colors
Financial Data with Molecular Background Concept
Digital Data Analysis and Cyber Security Concept Background
Colorful Bar Graph on Dark Background Illustrates Data Trends
Abstract Digital Interface with Network Connections and Data Visualizations
Premium
Digital price movement chart overlaid on a dynamic, abstract background, representing financial data and market analysis.
Abstract Financial Graph with Bar and Line Charts on Dark Background
Global Analytics Dashboard with Zigzag Chart on Dark Interface
Dynamic Financial Data Elements on Abstarct Grid
Financial Chart and Rotating Globe on Digital Grid Background
Dynamic Financial Data Visualization with Blue Trends
Cybersecurity Innovation Technology Illustrating Data Analysis
Digital Financial Data Processing with Graphs and Charts
Premium
AI data analytics dashboard, business data insights, AI-powered data analysis dashboard, business strategy, Analyst or Scientist uses a computer and dashboard for analysis of information development
Premium
Smart factory engineer managing industrial operations with a data driven ERP system, viewing production analytics and performance charts on a digital tablet.
Digital Interface with Data Graphs and Charts on Blue Background
Dynamic Line Chart with Histogram on Digital Grid Background
Abstract Digital Financial Data Chart with Pink Line Oscillations
Global Finance and COVID-19 Impact Representation
Premium
Businessman using AI predictive analytics with futuristic data visualization, graphs, and charts for business intelligence and technology solutions.
Digital Earth with Global Business Data Analysis Interface
Futuristic Financial Data Analysis with Rising White Line Graph
Abstract Financial Data Processing and Analysis Interface
Premium
Industrial analytics smart factory manufacturing production line dashboard machine learning data visualization predictive maintenance quality control efficiency
Abstract Financial Market Data Analysis Visualization
Premium
Web analytics dashboard. Marketing data visualization. Statistical graphs and reports. Businessperson analyzing website traffic using a laptop computer.
Fluctuating Digital Stock Market Data Chart
Digital Data and Financial Charts on White Background
Abstract Digital Data Network with Graphs and Symbols
Neon Graph with Sunset Glow on Digital Grid Background
Futuristic Financial Data Processing with Digital Interface Elements
Data Visualization with Graph and Globe for Business Analytics
Dynamic Financial Data Display in Digital Space
Data Analysis Graphics on Digital Grid Background
Premium
Abstract visualization of dynamic data trends showcasing smooth waves in red and blue on a light background representing modern analytics and technology concepts
Futuristic Data Visualization with Financial Statistics
Dynamic Financial Data Processing with Futuristic Graphic Interface
Economic and Political Factors Influence Investment Trends
Abstract Neon Digital Waveform on Futuristic Network Background
Premium
Business analyst working on laptop with holographic dashboard charts and data visualization graphs. Concept of big data, analytics, business intelligence, and financial statistics. crm marketing
Premium
Digital blue glowing graph with rising arrow binary code background futuristic data visualization financial growth technology abstract modern success progress innovation optimism
Premium
Financial market analysis with stock graph overlay and industrial skyline at dusk
Dynamic Financial Data Visualization on Digital Grid Background
Dynamic Graph Illustration Depicting Financial Growth
Futuristic Digital DNA Interface with Cosmic Background
Dynamic Data Flow Over Digital Graphical Interface
Digital Finance: Modern Stock Market Analysis Display
Futuristic Data Processing Animation with Media Icons
Colorful Financial Graph with Digital Technology Concept
Dynamic Financial Data Analysis with Graph Overlays
Financial Data Analysis on Blue Digital Interface
Rising Financial Data Graph on Digital Grid Background
Financial Data Overlay on Cityscape Visualizing Market Trends
Premium
Holographic business dashboard displaying pie chart and bar graph with futuristic blue and orange data visualization
Neon Digital Data Dashboard with Interactive Analytics Interface
Concentric HUD Overlay on Candlestick Chart with Blue Trend Line and Analytics Dashboard
Abstract Financial Data Visualization with Graphs
AI
Colorful Stock Market Chart with Trend Analysis
Financial Graph Over Radar Screen Indicating Market Trends
Premium
Close up of a person s hands holding a smartphone displaying a complex data visualization app
Futuristic Digital Interface with Data Graphs
Data Visualization on Digital Grid with Technological Interface
Abstract Data Visualization Digital Chart Background
Dynamic Analytics Dashboard with Engagement Alerts
Premium
Silhouettes of professionals with a world map and data visualization in a global business concept
Digital Financial Data Visualization with Futuristic Elements
Global Data Analytics on Digital Grid Interface
Global Business Finance Data Analysis Visualization
Futuristic Multi-Series Data Visualization Dashboard Chart
Premium
Business analytics growth performance chart, digital marketing metrics visualization on businessman hand and laptop, Digital marketing ROI, CTR, and CRO growth data visualization, business performance
Dynamic Financial Graph on Digital Background
Futuristic Stock Market Graph With Digital Overlay
Futuristic Graph and Data Technology Interface
Explore More Free Stock Images