
- Home >
- Stock Photos >
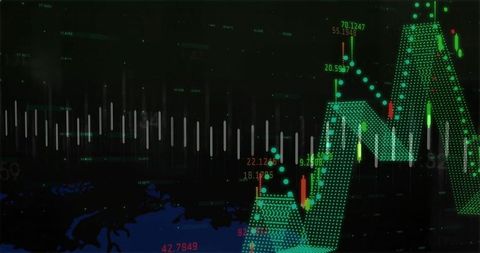
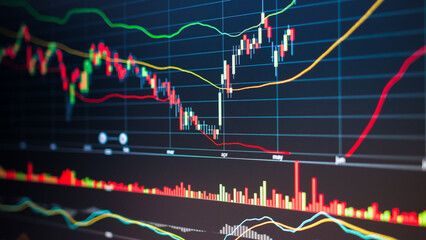
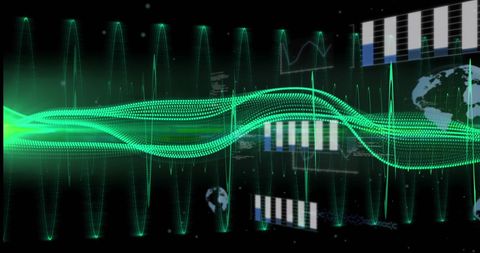
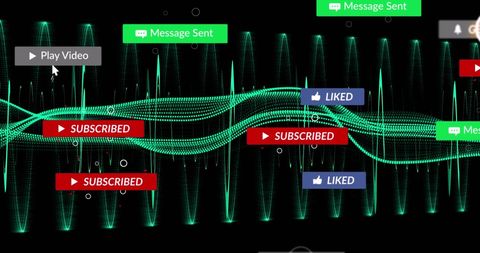
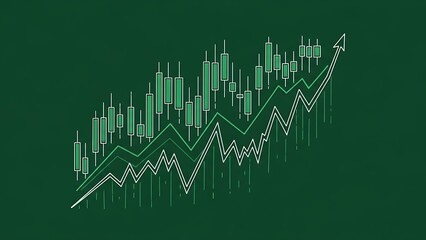
- Futuristic Data Analytics with Candlestick Charts on Hex Grid
Futuristic Data Analytics with Candlestick Charts on Hex Grid Image

This image showcases a digital dashboard on a hex grid, featuring complex analytics elements such as candlestick charts, spikes, and wave lines. Awash with vivid green and blue, the visuals give off a futuristic, high-tech vibe. Suitable for illustrating concepts in data science, finance, stock market analysis, or technology advancements. This depiction can be used by tech websites, business intelligence platforms, or to create engaging presentations highlighting data analysis advancements.
Powered by 


downloads
Tags:
More
Credit Photo
If you would like to credit the Photo, here are some ways you can do so
Text Link
photo Link
<span class="text-link">
<span>
<a target="_blank" href=https://pikwizard.com/photo/futuristic-data-analytics-with-candlestick-charts-on-hex-grid/b5abafa6d5bf18ceca0b335fb3cac11a/>PikWizard</a>
</span>
</span>
<span class="image-link">
<span
style="margin: 0 0 20px 0; display: inline-block; vertical-align: middle; width: 100%;"
>
<a
target="_blank"
href="https://pikwizard.com/photo/futuristic-data-analytics-with-candlestick-charts-on-hex-grid/b5abafa6d5bf18ceca0b335fb3cac11a/"
style="text-decoration: none; font-size: 10px; margin: 0;"
>
<img src="https://pikwizard.com/pw/medium/b5abafa6d5bf18ceca0b335fb3cac11a.jpg" style="margin: 0; width: 100%;" alt="" />
<p style="font-size: 12px; margin: 0;">PikWizard</p>
</a>
</span>
</span>
Free (free of charge)
Free for personal and commercial use.
Author: People Creations
Similar Free Stock Images

Premium


Premium


Premium


Premium


Premium


Premium


Premium

Premium


Premium

Premium
Premium


Premium


Premium

Premium


Premium


Premium


Premium

Premium


Premium

Premium


Premium

Premium


Premium


Premium


Premium


Explore More Free Stock Images