- Home >
- Stock Photos >
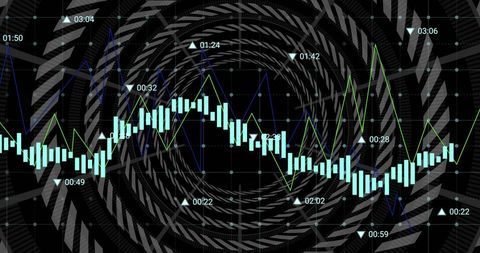
- Futuristic Data Analytics with Graph Overlays on Digital Display
Futuristic Data Analytics with Graph Overlays on Digital Display Image

Illustrates intricate graphical representation of data.All technology enthusiasts, data analysts, or businesses can use image focusing on visualization. Impactful with graphics plotted dynamically against dark technology-themed background.Signifies processes of evaluation or interpretation.Great for presentations, articles, or collateral conveying advanced data use, analysis, or forecasting visually appealing way.

downloads
Tags:
More
Credit Photo
If you would like to credit the Photo, here are some ways you can do so
Text Link
photo Link
<span class="text-link">
<span>
<a target="_blank" href=https://pikwizard.com/photo/futuristic-data-analytics-with-graph-overlays-on-digital-display/08d609afea544b09219aafd2731820e9/>PikWizard</a>
</span>
</span>
<span class="image-link">
<span
style="margin: 0 0 20px 0; display: inline-block; vertical-align: middle; width: 100%;"
>
<a
target="_blank"
href="https://pikwizard.com/photo/futuristic-data-analytics-with-graph-overlays-on-digital-display/08d609afea544b09219aafd2731820e9/"
style="text-decoration: none; font-size: 10px; margin: 0;"
>
<img src="https://pikwizard.com/pw/medium/08d609afea544b09219aafd2731820e9.jpg" style="margin: 0; width: 100%;" alt="" />
<p style="font-size: 12px; margin: 0;">PikWizard</p>
</a>
</span>
</span>
Free (free of charge)
Free for personal and commercial use.
Author: Authentic Images