
- Home >
- Stock Photos >
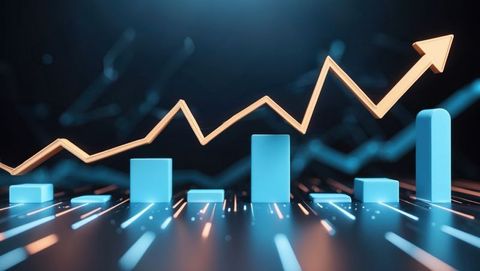
- Futuristic Data Analytics with Rising Bar Chart and Arrow
Futuristic Data Analytics with Rising Bar Chart and Arrow Image
AI
AI Generated Image. A visually striking digital rendering showcasing data growth and analysis with a blue bar chart rising beneath a reflective surface and an upward-moving gold line graph overlay. Neon lights add a modern touch, lending a futuristic feel to the design. Perfect for presentations or articles focusing on data analysis, technology advancements, digital marketing strategies, and business growth forecasting. Suitable accompaniment for AI-generated analytics reports or infographics on trends in technology or financial sectors.
Powered by  - Get 15% off with code: PIKWIZARD15


downloads
Tags:
More
Credit Photo
If you would like to credit the Photo, here are some ways you can do so
Text Link
photo Link
<span class="text-link">
<span>
<a target="_blank" href=https://pikwizard.com/photo/futuristic-data-analytics-with-rising-bar-chart-and-arrow/8e402346e7e70e7be0f5318b81e1dff7/>PikWizard</a>
</span>
</span>
<span class="image-link">
<span
style="margin: 0 0 20px 0; display: inline-block; vertical-align: middle; width: 100%;"
>
<a
target="_blank"
href="https://pikwizard.com/photo/futuristic-data-analytics-with-rising-bar-chart-and-arrow/8e402346e7e70e7be0f5318b81e1dff7/"
style="text-decoration: none; font-size: 10px; margin: 0;"
>
<img src="https://pikwizard.com/pw/medium/8e402346e7e70e7be0f5318b81e1dff7.jpg" style="margin: 0; width: 100%;" alt="" />
<p style="font-size: 12px; margin: 0;">PikWizard</p>
</a>
</span>
</span>
Free (free of charge)
Free for personal and commercial use.
Author: AI Creator
Similar Free Stock Images

Premium


Premium

Premium


AI

AI


Premium

Premium

Premium

Premium


AI


Premium

Premium


Premium

Premium


AI


Premium

AI


Premium

Premium

Premium

Premium


AI


AI

Premium


Premium


AI


Premium

Premium


Premium


AI


AI

Premium

Premium


Premium


AI


AI


Premium


Explore More Free Stock Images