
- Home >
- Stock Photos >
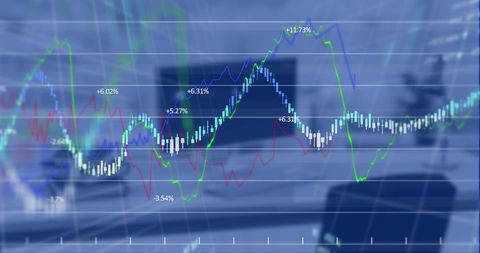
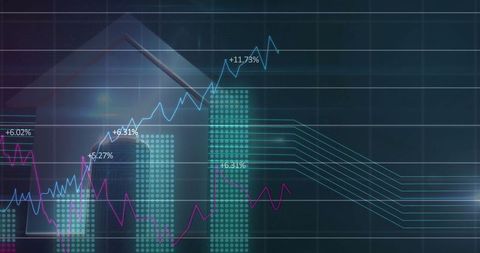
- Futuristic Data Chart on Digital Dashboard with Modern Interface
Futuristic Data Chart on Digital Dashboard with Modern Interface Image

Futuristic chart featuring blue bars and a red line showcasing data trends on a digitally layered dashboard interface. Suited for illustrating financial reports, technology platforms, and innovation-centered environments. Captures the essence of modern analytics and tech advancements.
Powered by 


downloads
Tags:
More
Credit Photo
If you would like to credit the Photo, here are some ways you can do so
Text Link
photo Link
<span class="text-link">
<span>
<a target="_blank" href=https://pikwizard.com/photo/futuristic-data-chart-on-digital-dashboard-with-modern-interface/b6048458dfe8ec68cc300d2f77119fcf/>PikWizard</a>
</span>
</span>
<span class="image-link">
<span
style="margin: 0 0 20px 0; display: inline-block; vertical-align: middle; width: 100%;"
>
<a
target="_blank"
href="https://pikwizard.com/photo/futuristic-data-chart-on-digital-dashboard-with-modern-interface/b6048458dfe8ec68cc300d2f77119fcf/"
style="text-decoration: none; font-size: 10px; margin: 0;"
>
<img src="https://pikwizard.com/pw/medium/b6048458dfe8ec68cc300d2f77119fcf.jpg" style="margin: 0; width: 100%;" alt="" />
<p style="font-size: 12px; margin: 0;">PikWizard</p>
</a>
</span>
</span>
Free (free of charge)
Free for personal and commercial use.
Author: Creative Art
Similar Free Stock Images

Premium


Premium

Premium


Premium


Premium


Premium


Premium


Premium


Premium


Premium


Premium


Premium


Premium


Premium


Premium


Premium


Premium


Premium


Premium


Premium


Premium


Premium


Premium


Premium


Premium

Explore More Free Stock Images