- Home >
- Stock Photos >
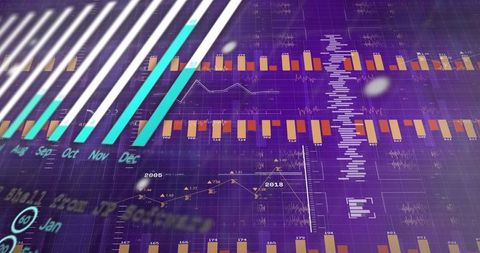
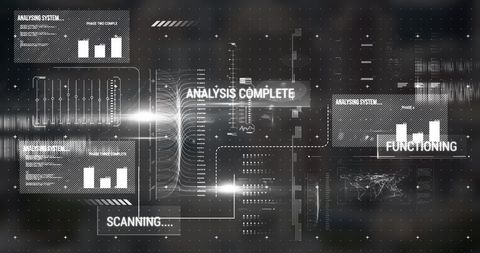
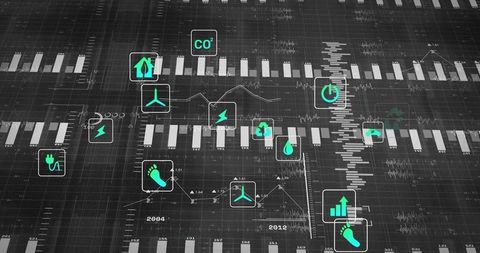
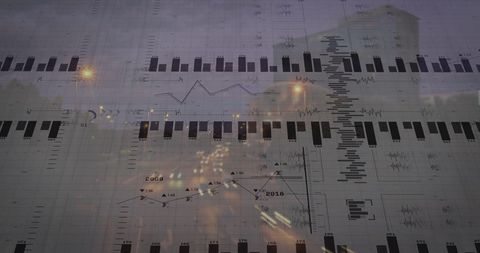
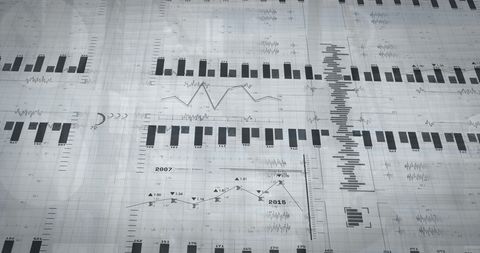
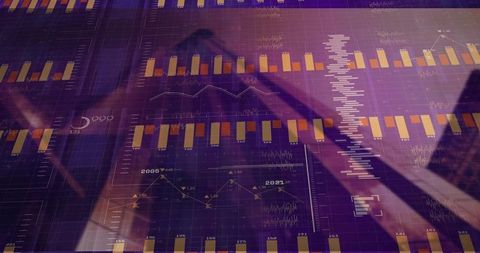
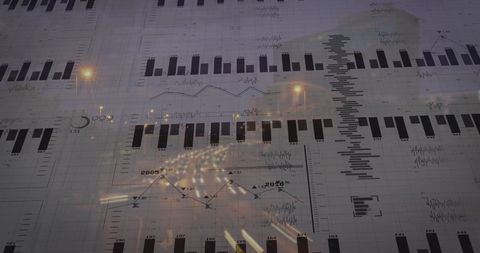
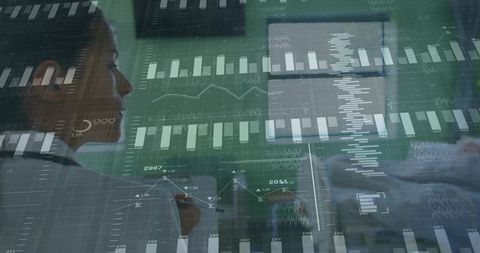
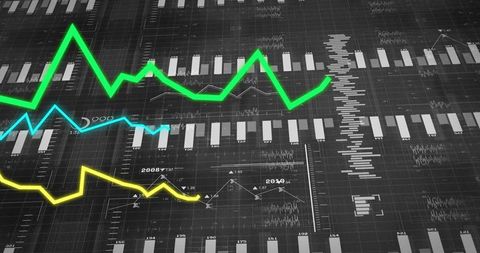
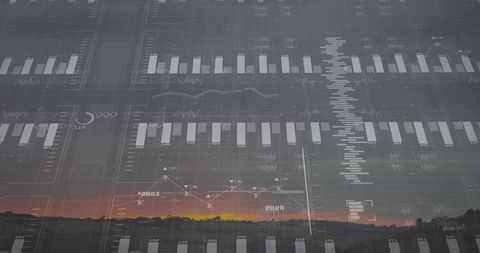
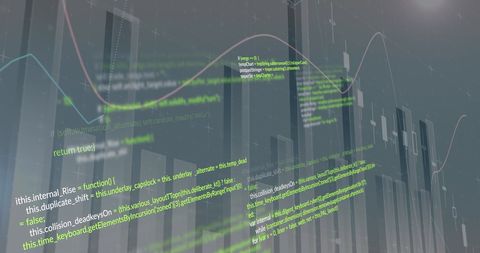
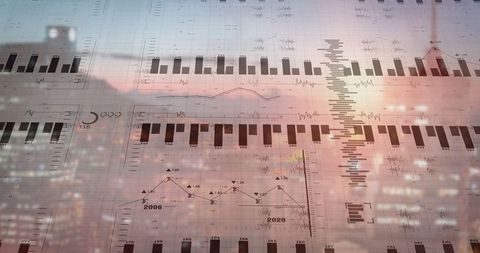
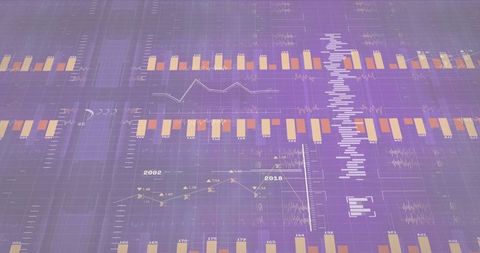
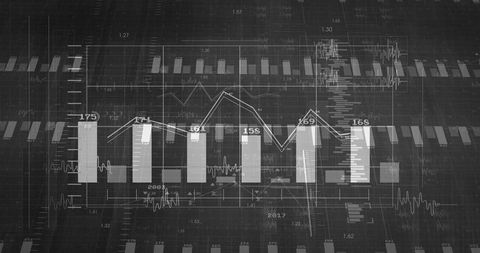
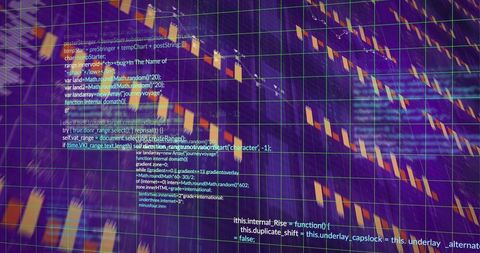
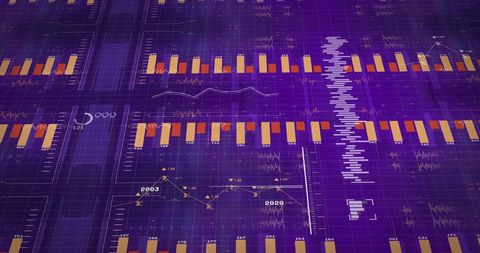
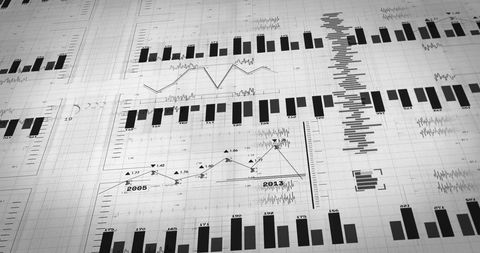
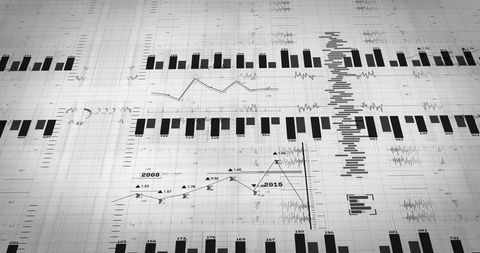
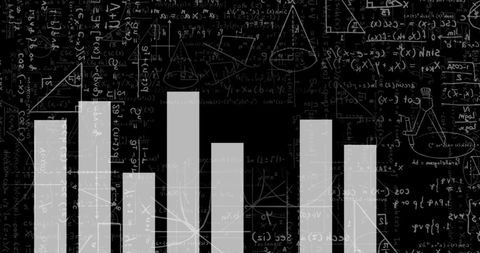
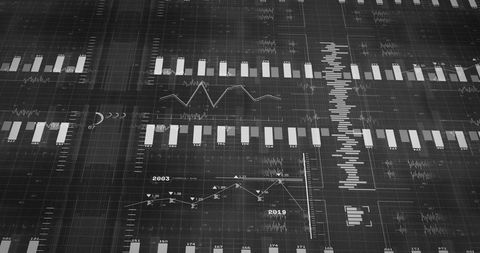
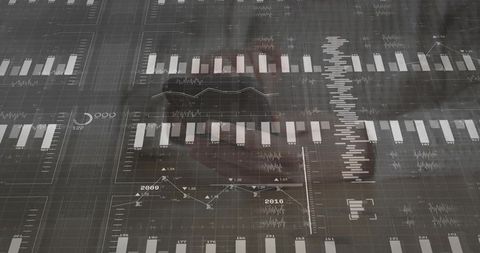
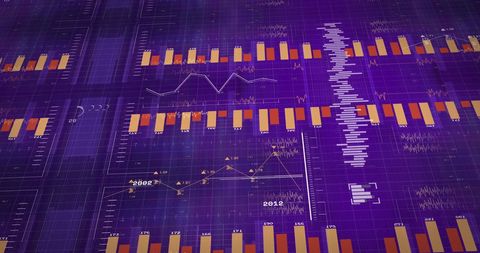
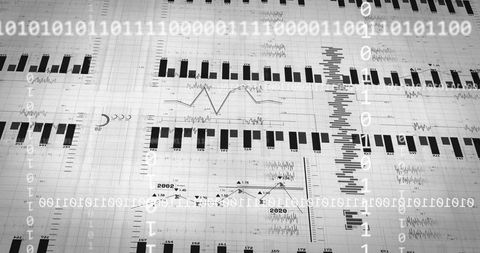
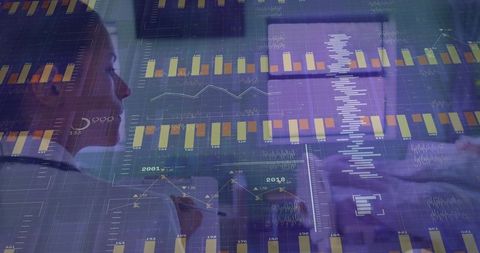
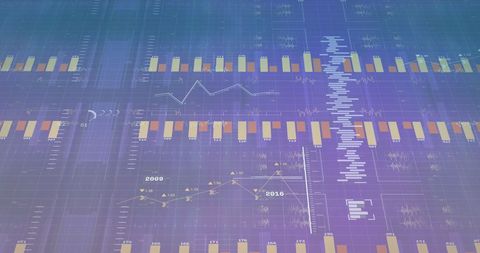
- Futuristic Data Dashboard: Code, Charts, and Analytics Visualization
Futuristic Data Dashboard: Code, Charts, and Analytics Visualization Image

A dynamic display integrates coding data with bar charts and line graphs, enhancing financial analytics and information systems. Ideal for illustrating themes connected down to modern processing, tech-driven strategies or understanding analytics transformation frequently sought in finance or programming training segments in it and software industry developments.

downloads
Tags:
More
Credit Photo
If you would like to credit the Photo, here are some ways you can do so
Text Link
photo Link
<span class="text-link">
<span>
<a target="_blank" href=https://pikwizard.com/photo/futuristic-data-dashboard-code-charts-and-analytics-visualization/02d933220ca2ecdfb2f7ecd50a7454f8/>PikWizard</a>
</span>
</span>
<span class="image-link">
<span
style="margin: 0 0 20px 0; display: inline-block; vertical-align: middle; width: 100%;"
>
<a
target="_blank"
href="https://pikwizard.com/photo/futuristic-data-dashboard-code-charts-and-analytics-visualization/02d933220ca2ecdfb2f7ecd50a7454f8/"
style="text-decoration: none; font-size: 10px; margin: 0;"
>
<img src="https://pikwizard.com/pw/medium/02d933220ca2ecdfb2f7ecd50a7454f8.jpg" style="margin: 0; width: 100%;" alt="" />
<p style="font-size: 12px; margin: 0;">PikWizard</p>
</a>
</span>
</span>
Free (free of charge)
Free for personal and commercial use.
Author: Creative Art