- Home >
- Stock Photos >
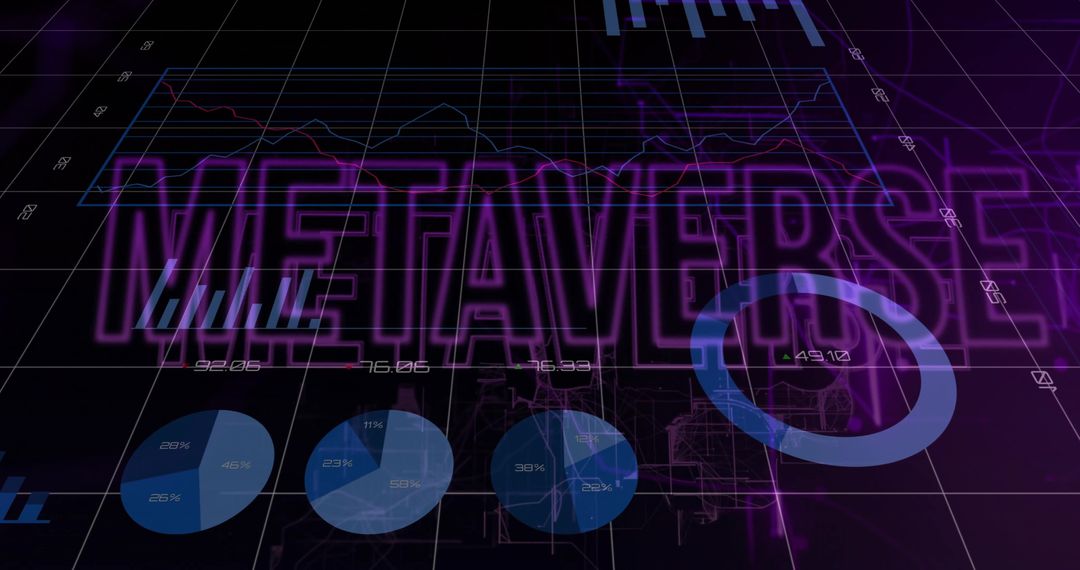
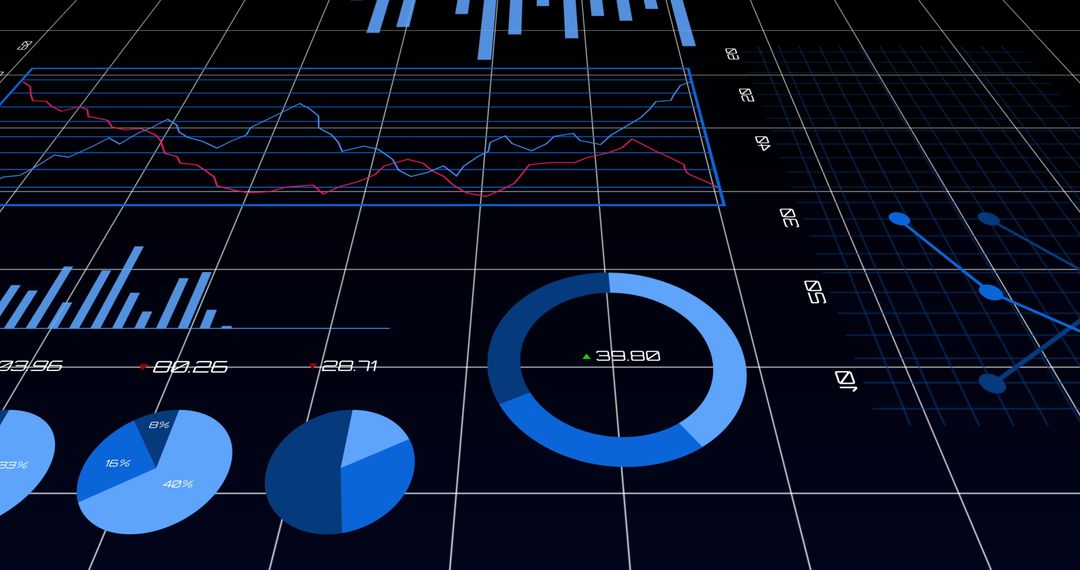
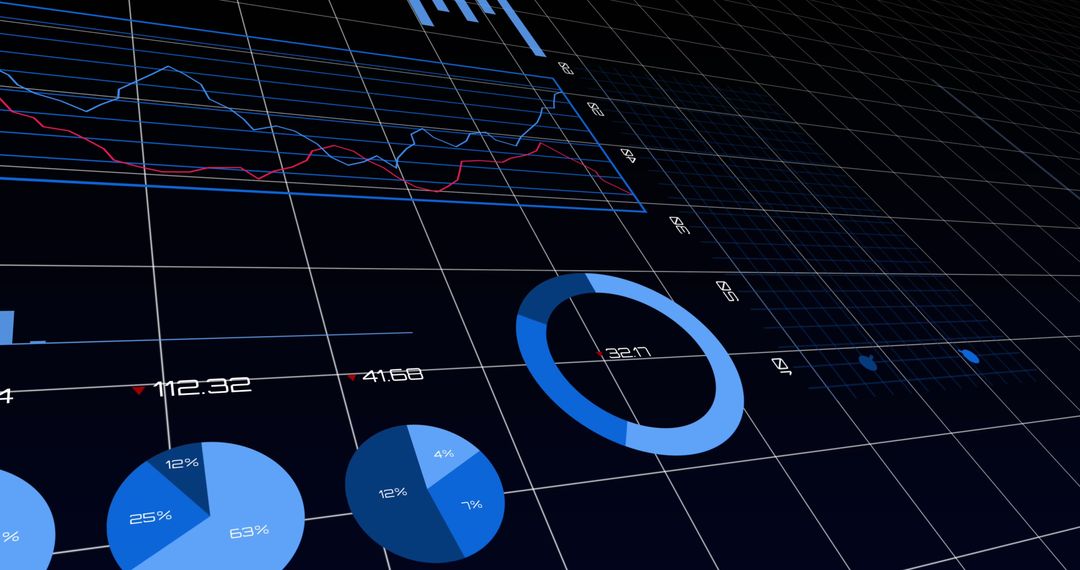
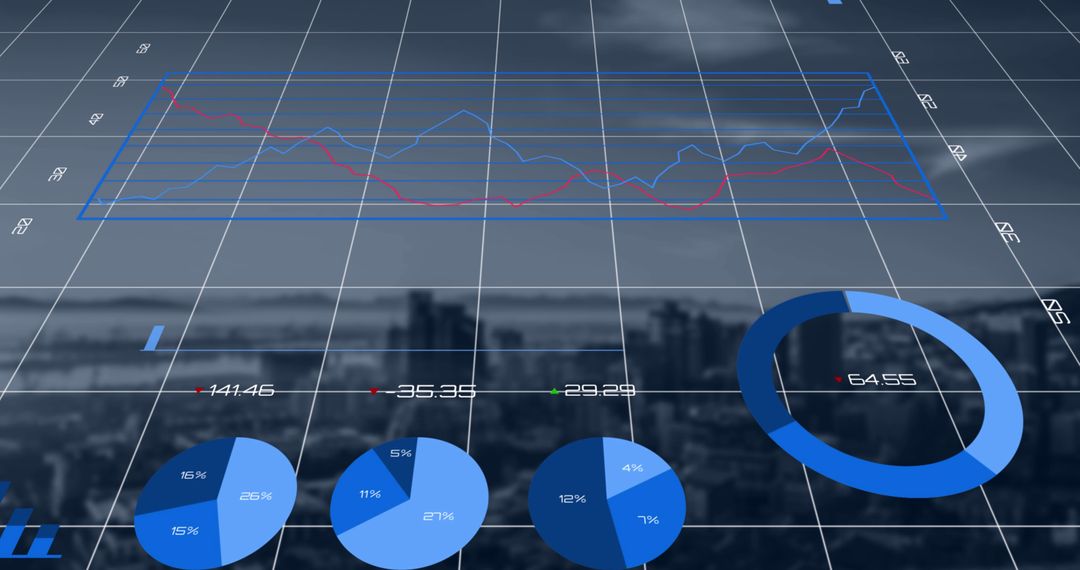
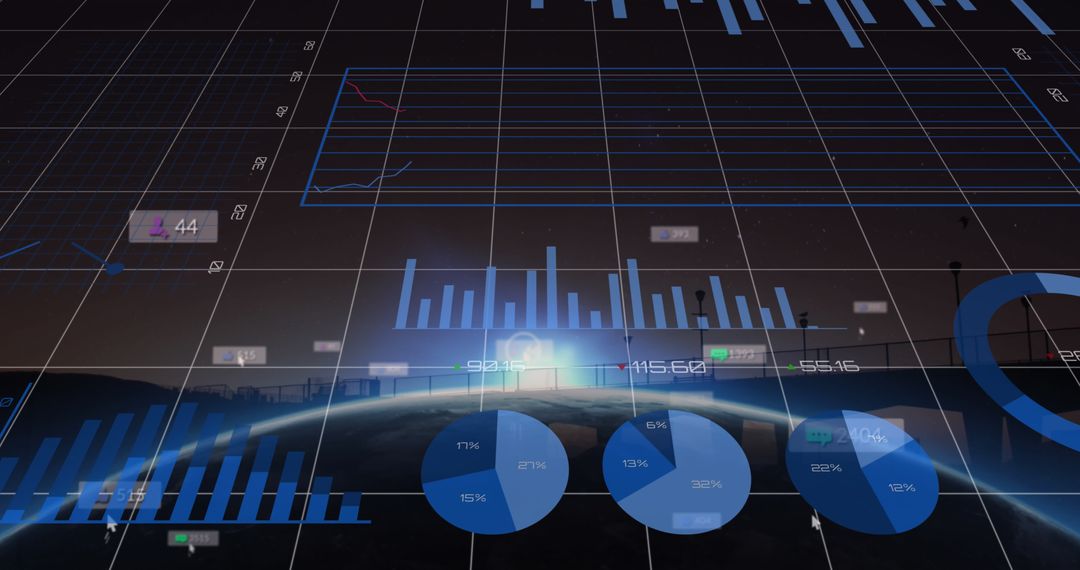
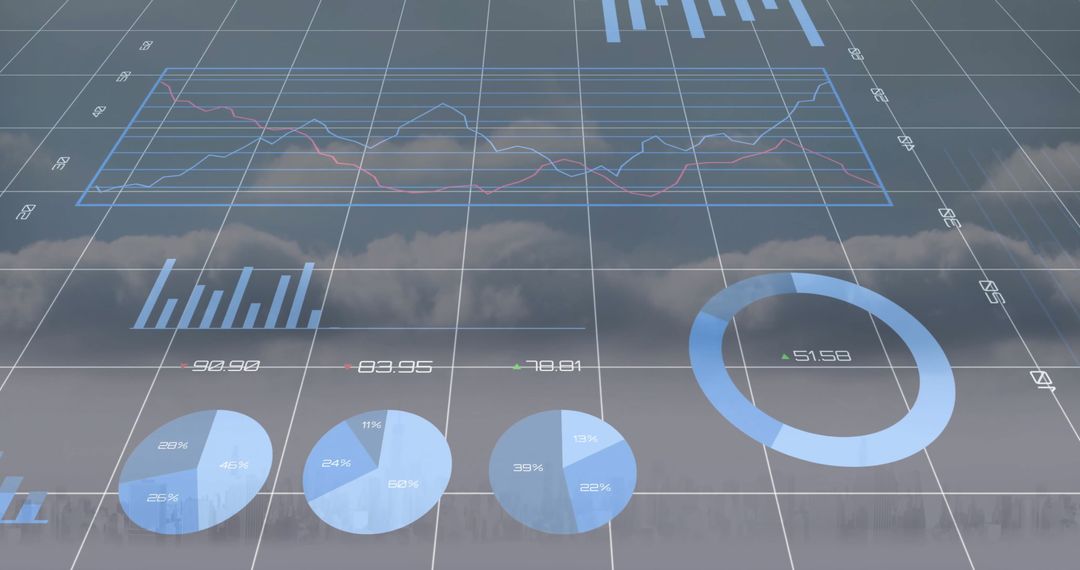
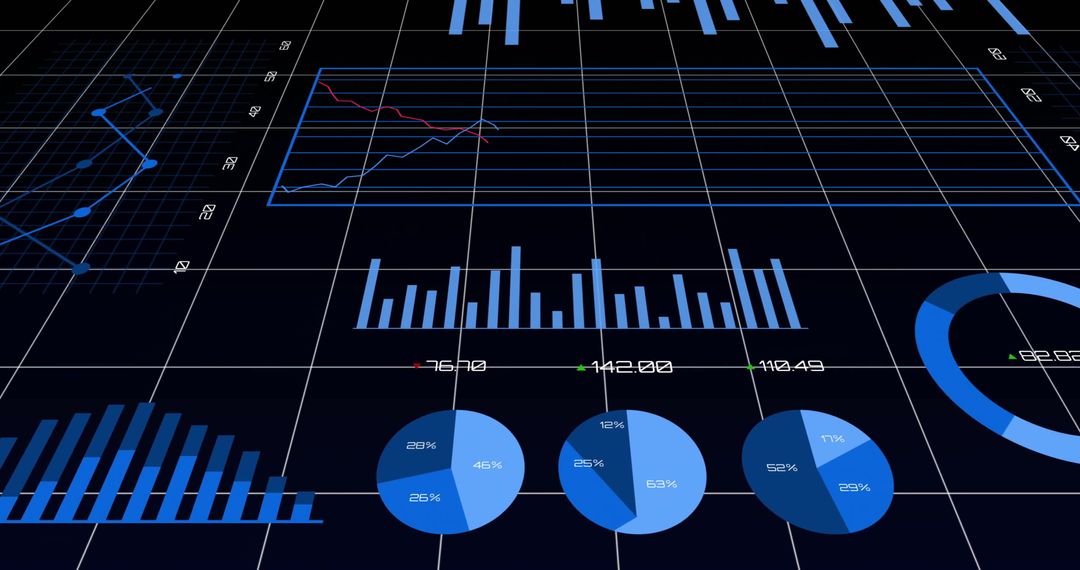
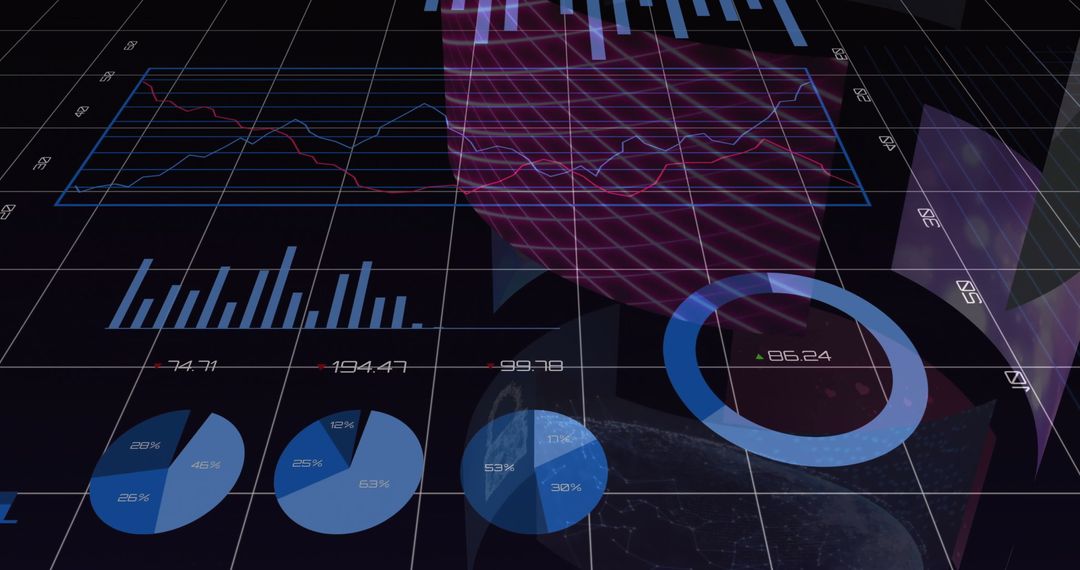
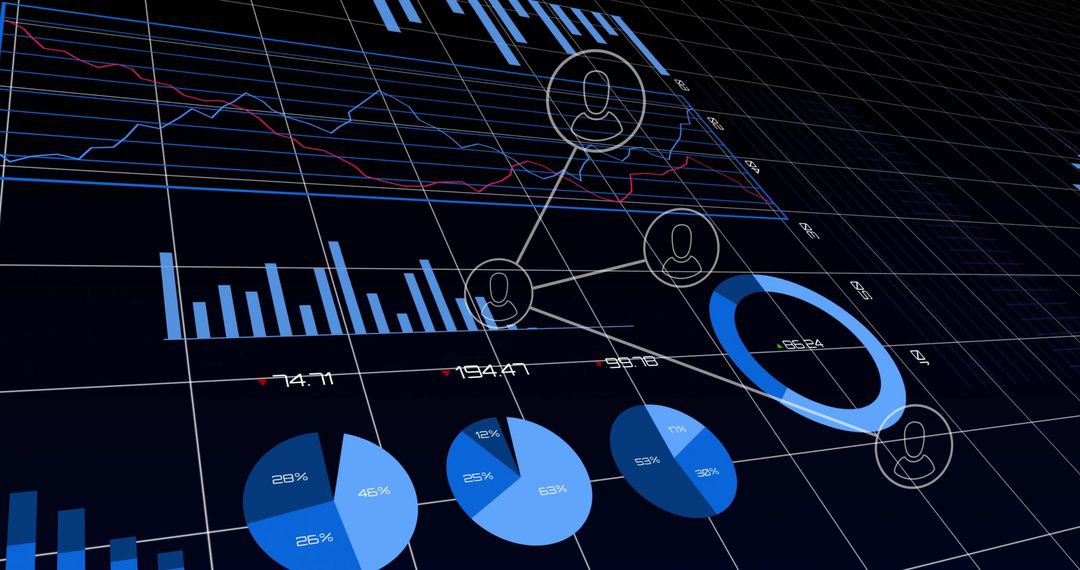
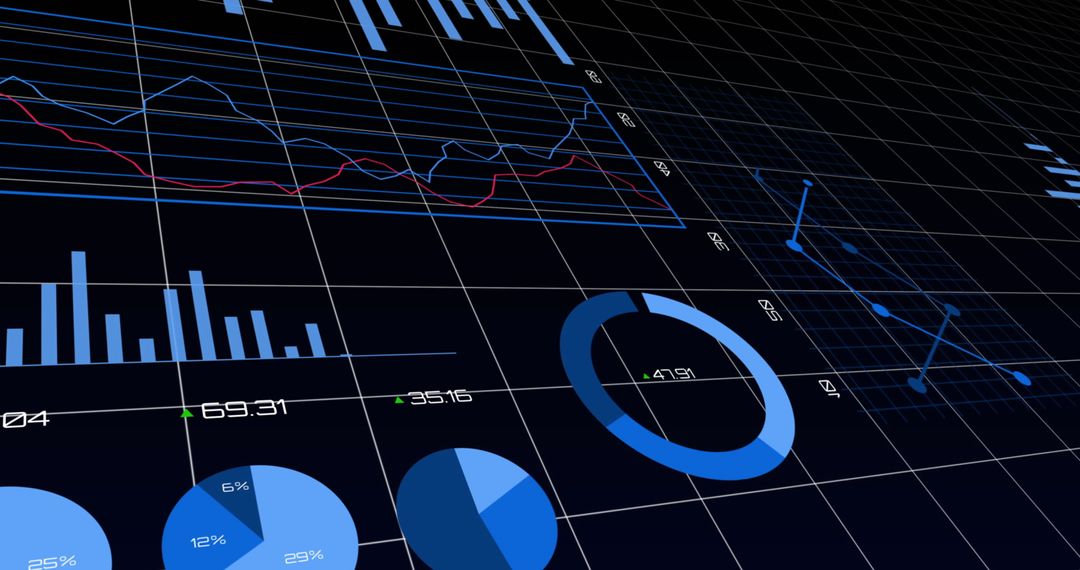
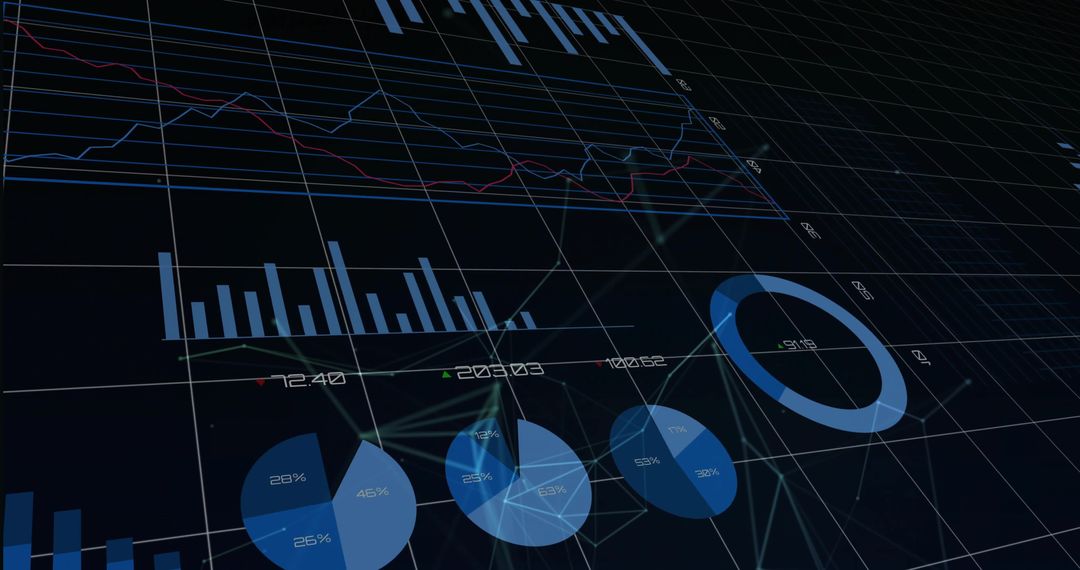
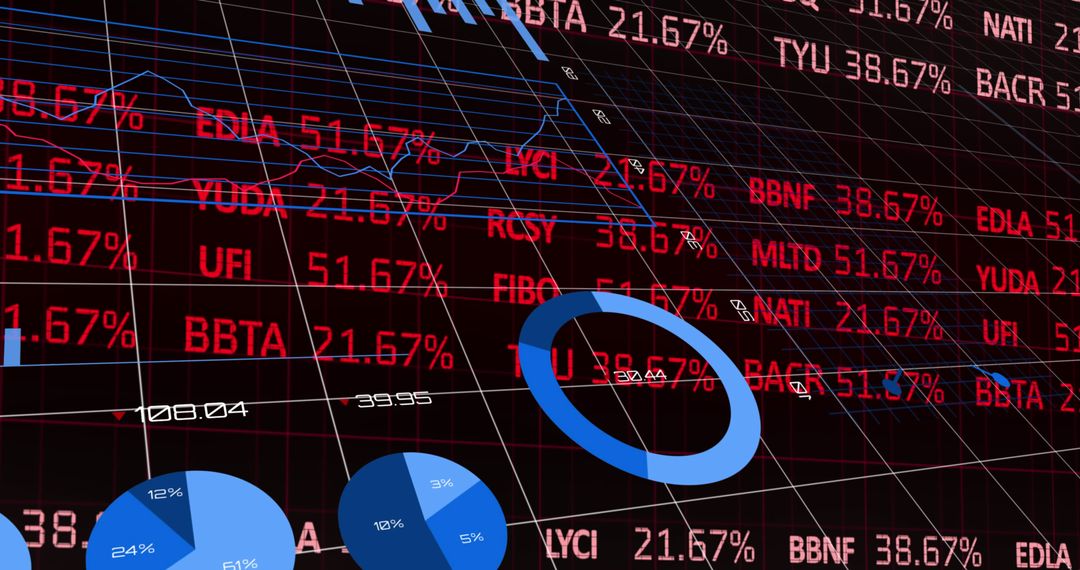
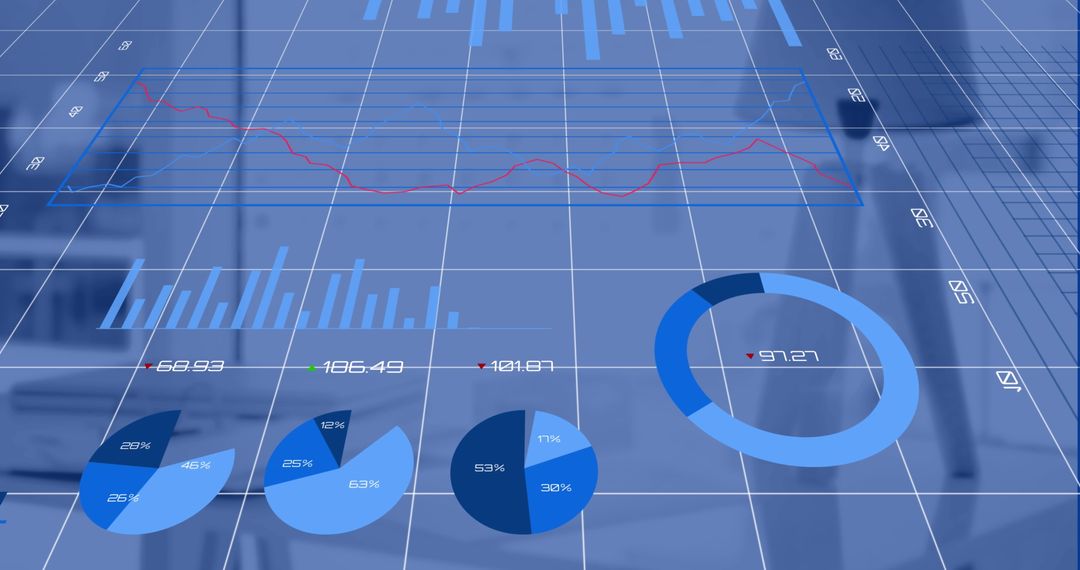
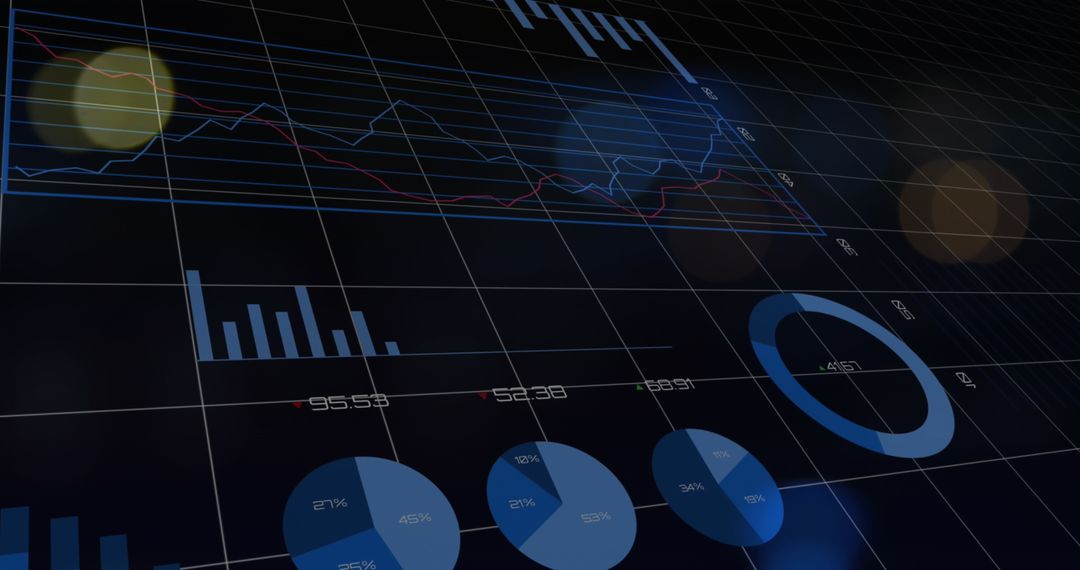
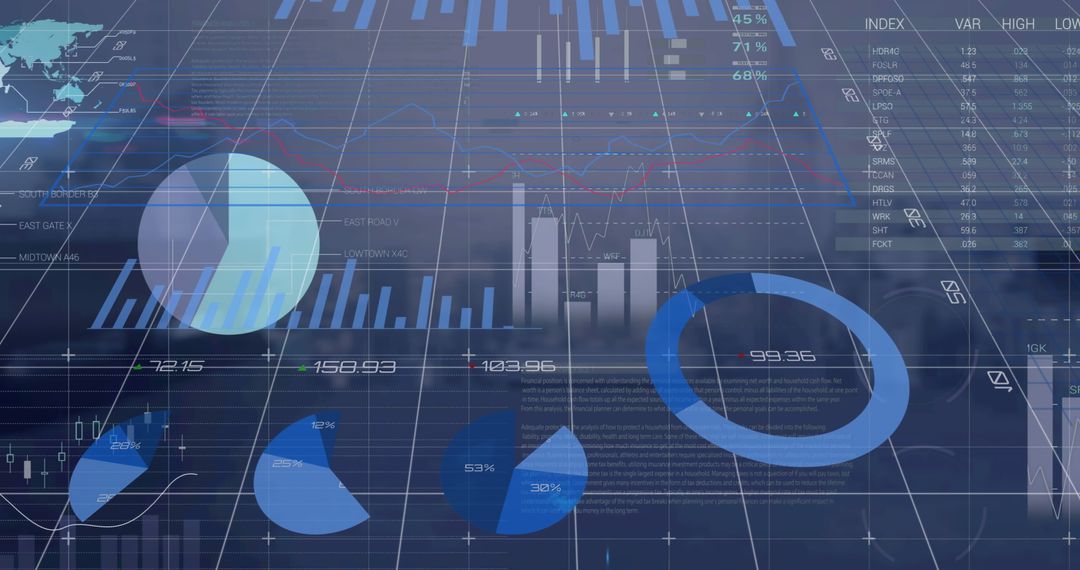
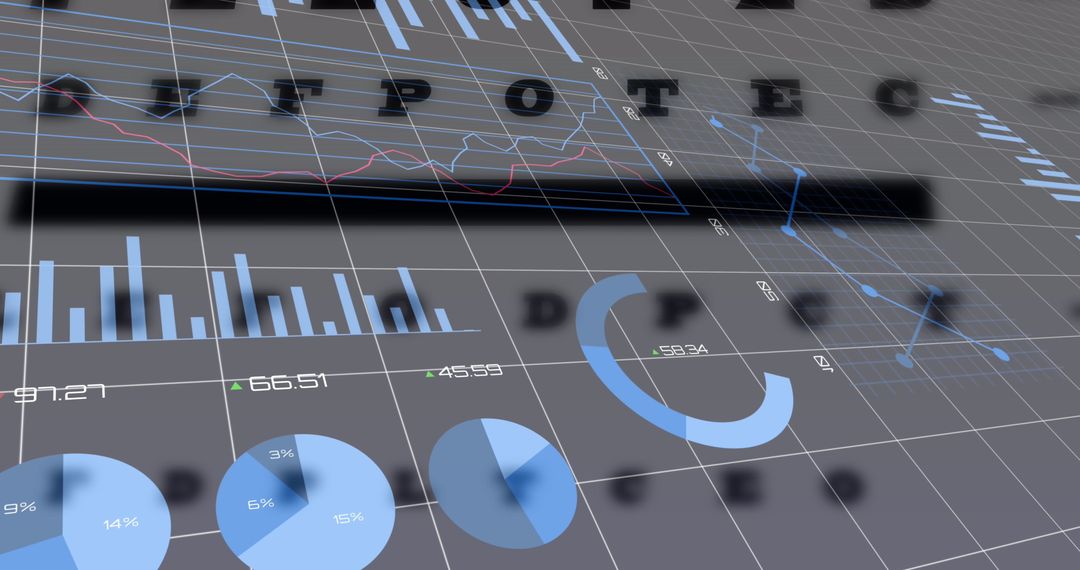
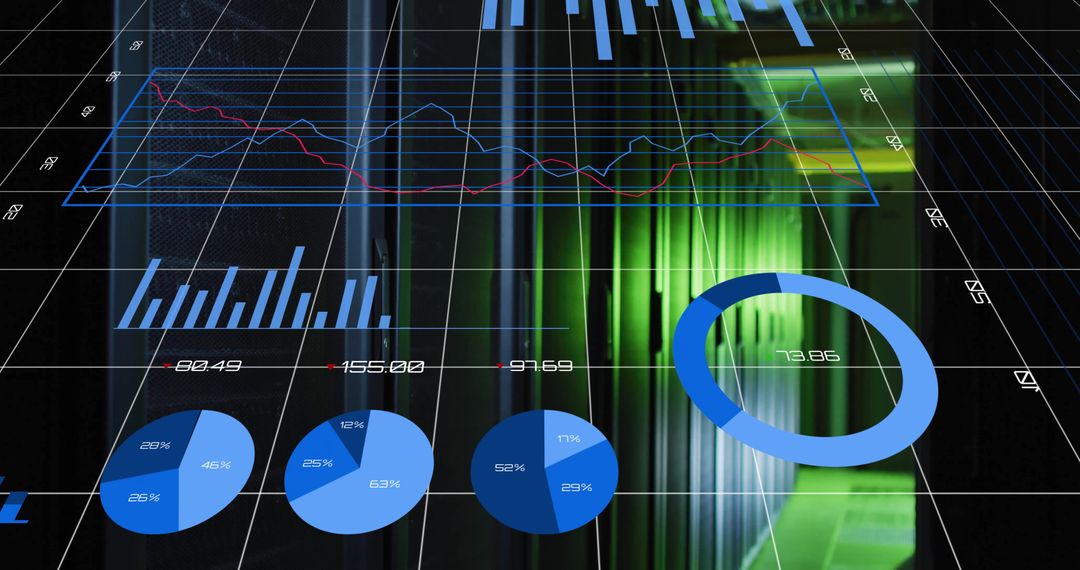
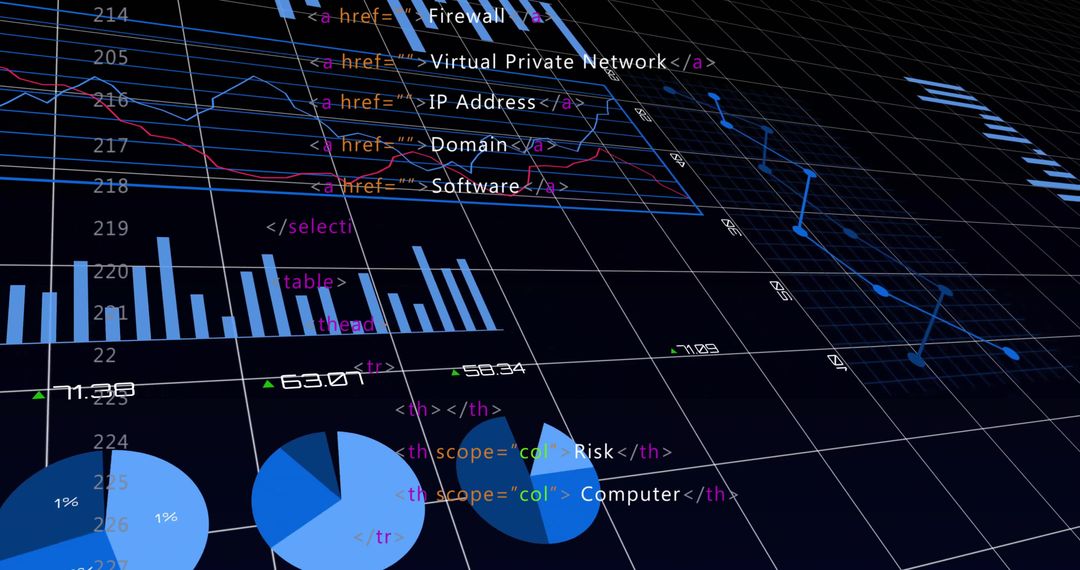
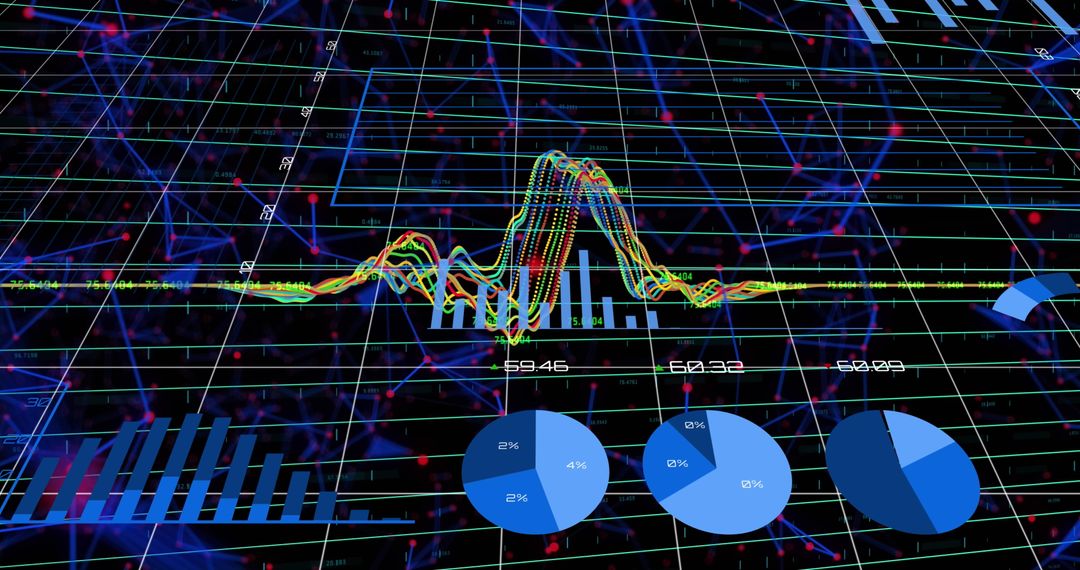
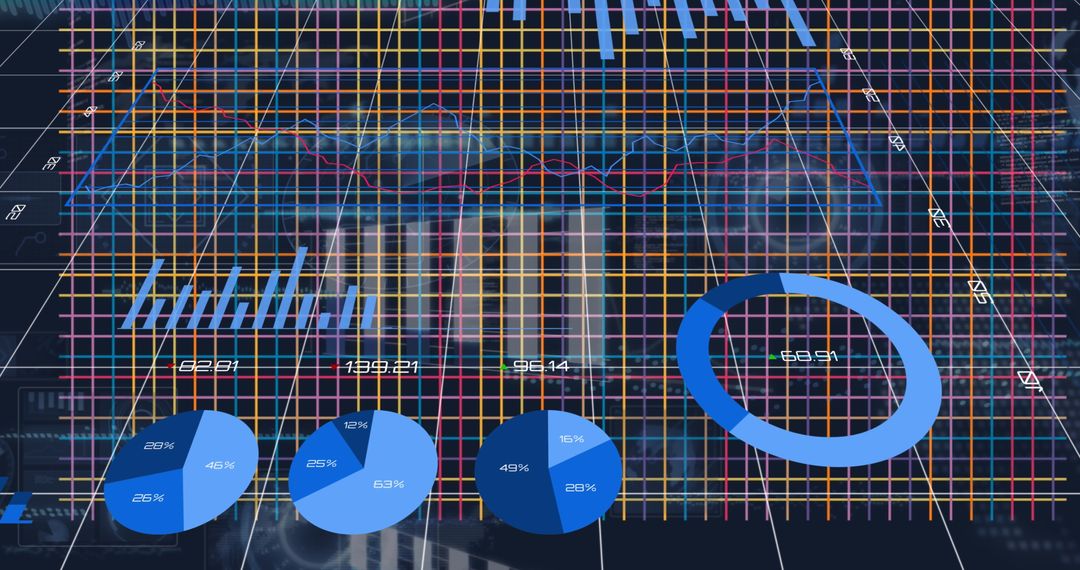
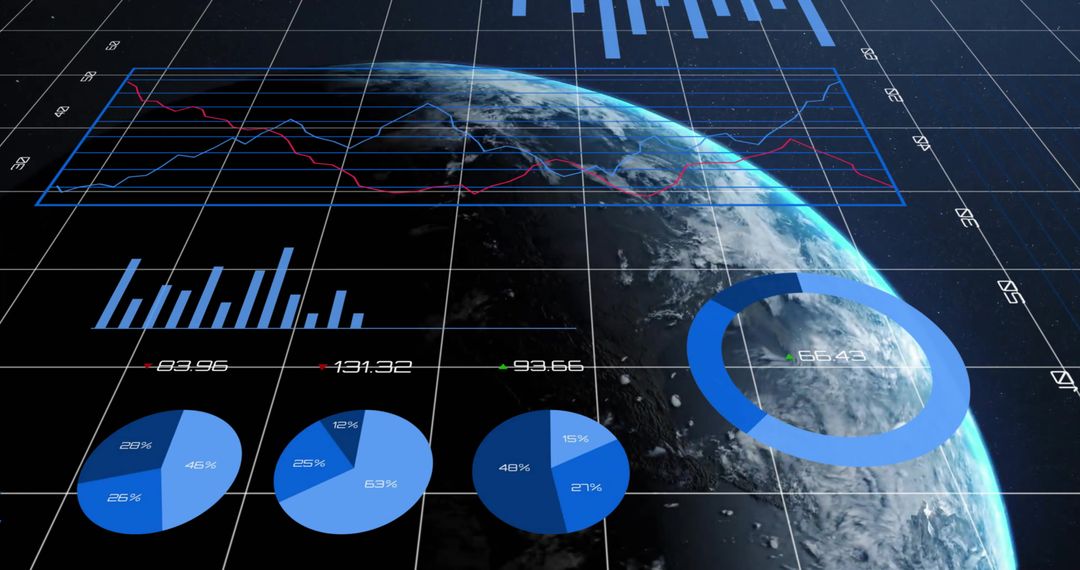
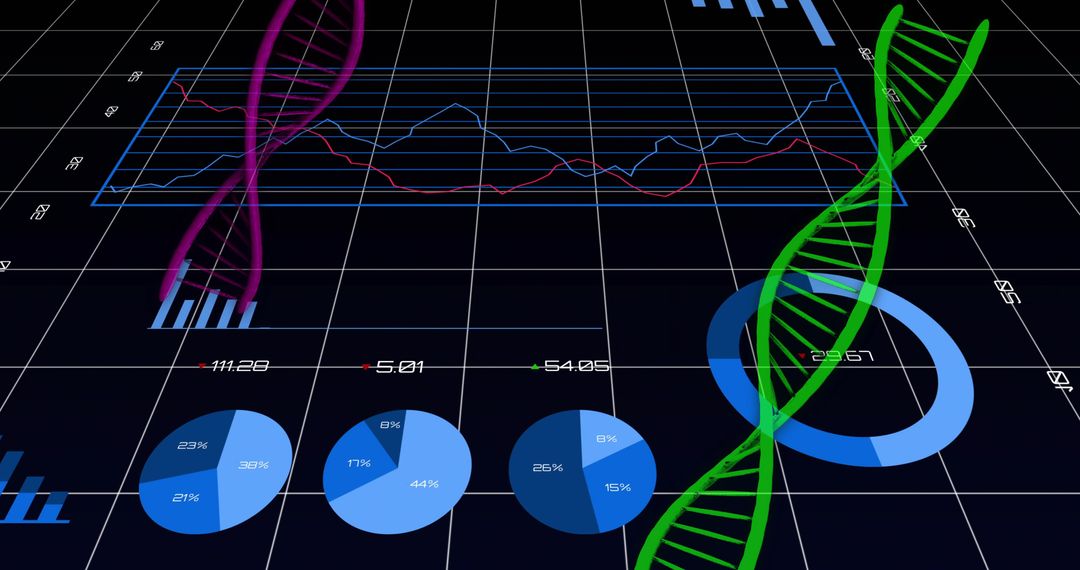
- Futuristic Data Dashboard Displaying 3D Line Graphs, Pie Charts, Donut Chart
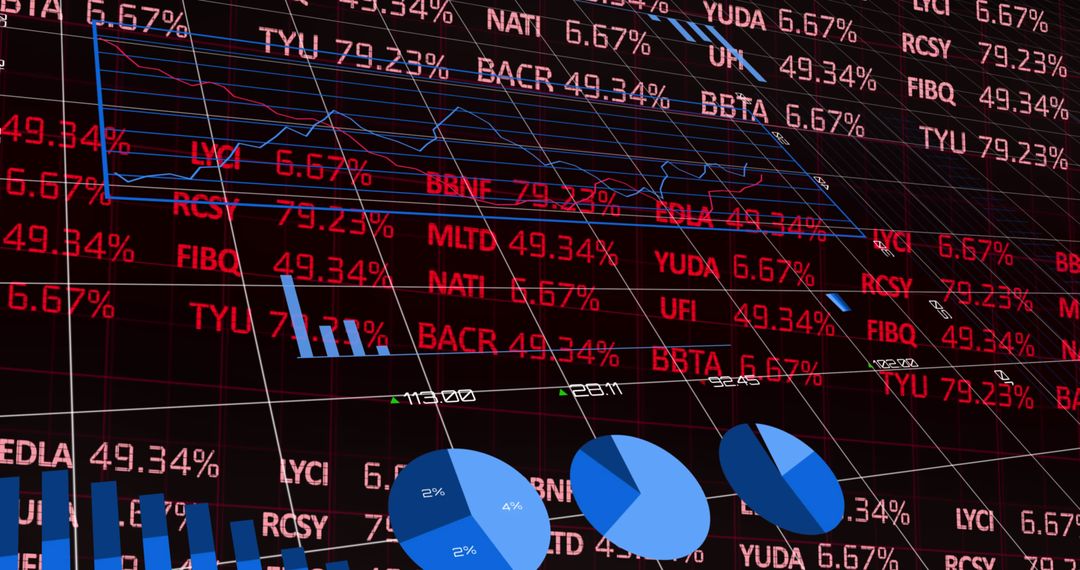
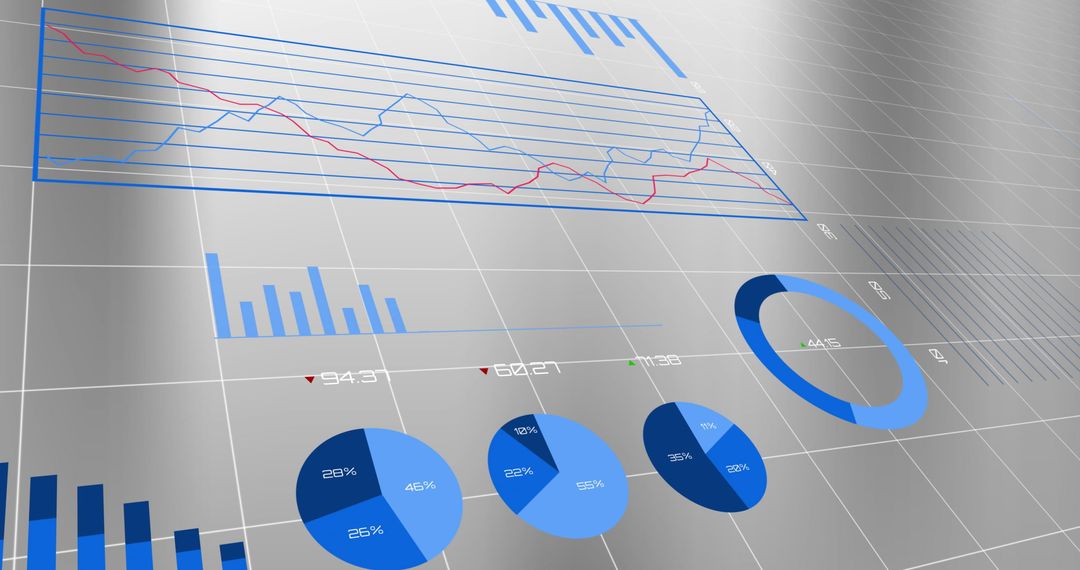
Futuristic Data Dashboard Displaying 3D Line Graphs, Pie Charts, Donut Chart Image

Displaying futuristic data dashboard on dark grid, showing 3D line graph tracking trend lines, multiple pie charts showing percentage breakdowns, large donut chart highlighting key KPI. Using cool blue color palette for high-tech, professional look, overlaid with faint code snippets and numeric readouts for data-driven atmosphere. Suitable for business intelligence, fintech, data science, analytics reports, investor presentations, website hero banners, slide decks, marketing collateral. Use for illustrating performance metrics, market trends, financial analysis, KPIs, predictive analytics, machine learning results. Editing tips: separate chart layers to replace values, adjust colors to match brand, overlay custom logos or annotations, crop for banner or thumbnail layouts.
Powered by  - Get 15% off with code: PIKWIZARD15


0
downloads
downloads
Tags:
More
Credit Photo
If you would like to credit the Photo, here are some ways you can do so
Text Link
photo Link
<span class="text-link">
<span>
<a target="_blank" href=https://pikwizard.com/photo/futuristic-data-dashboard-displaying-3d-line-graphs-pie-charts-donut-chart/e4ad0399ea0204cb5d505af2e71efafd/>PikWizard</a>
</span>
</span>
<span class="image-link">
<span
style="margin: 0 0 20px 0; display: inline-block; vertical-align: middle; width: 100%;"
>
<a
target="_blank"
href="https://pikwizard.com/photo/futuristic-data-dashboard-displaying-3d-line-graphs-pie-charts-donut-chart/e4ad0399ea0204cb5d505af2e71efafd/"
style="text-decoration: none; font-size: 10px; margin: 0;"
>
<img src="https://pikwizard.com/pw/medium/e4ad0399ea0204cb5d505af2e71efafd.jpg" style="margin: 0; width: 100%;" alt="" />
<p style="font-size: 12px; margin: 0;">PikWizard</p>
</a>
</span>
</span>
Free (free of charge)
Free for personal and commercial use.
Author: Creative Art
Similar Free Stock Images
Premium

Premium


Premium


Premium


Premium

Premium


Premium


Premium


Premium


Premium


Premium


Premium


Premium


Premium


Premium


Premium


Premium


Premium


Premium


Premium

Premium


Premium


Premium


Premium