- Home >
- Stock Photos >
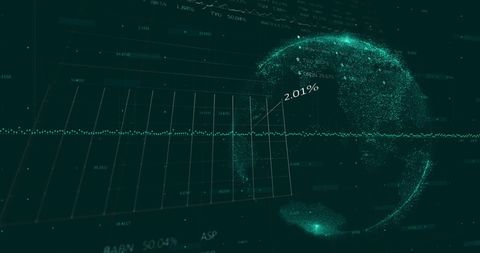
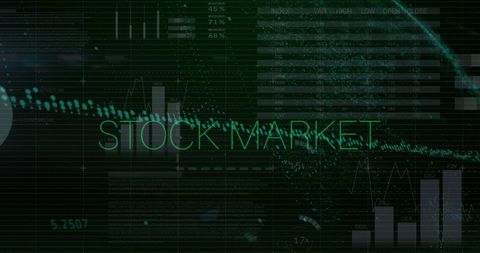
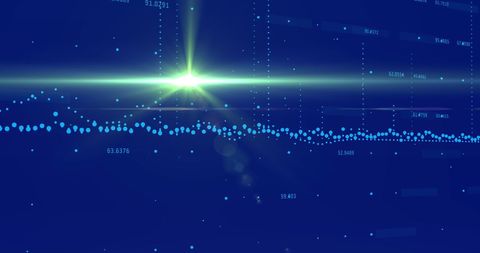
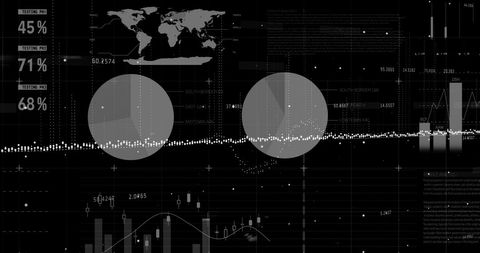
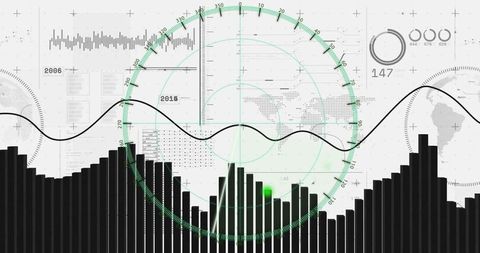
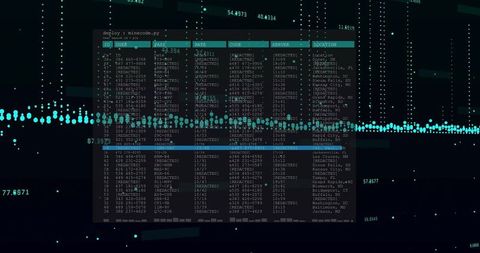
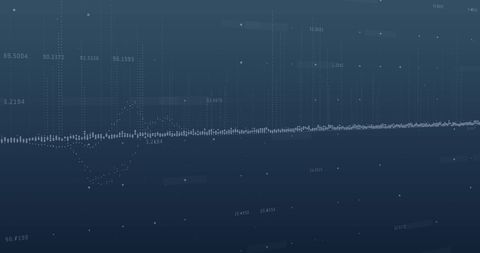
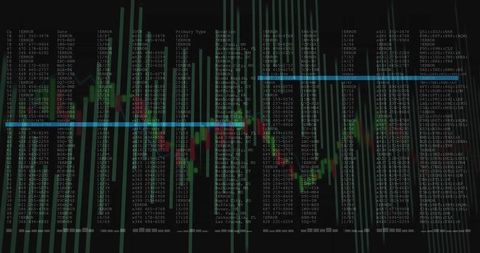
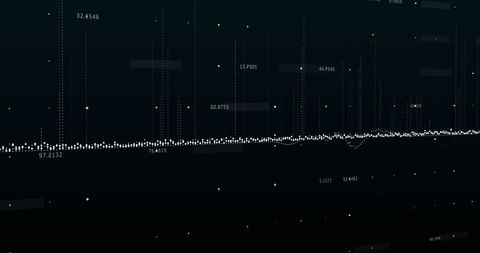
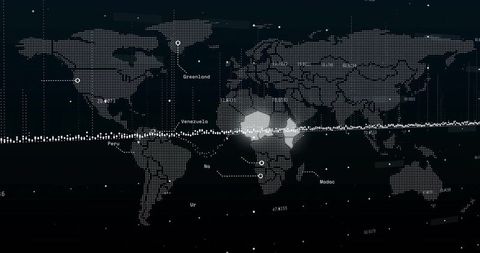
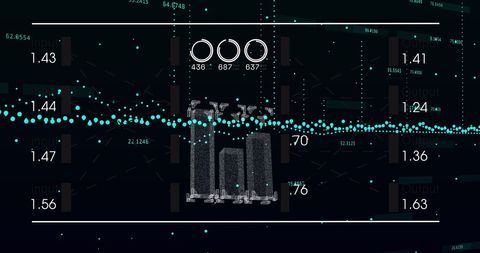
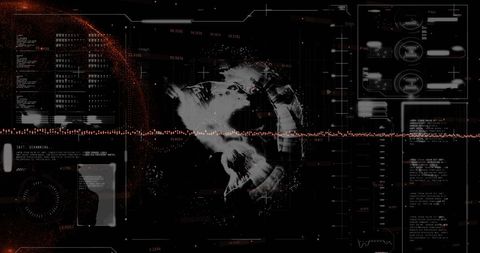
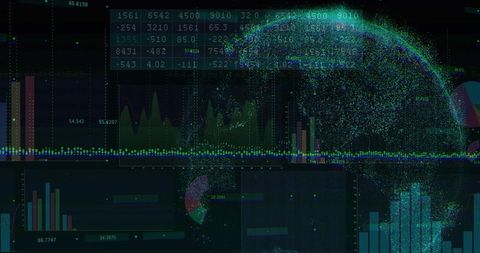
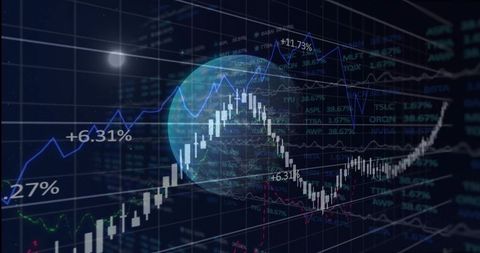
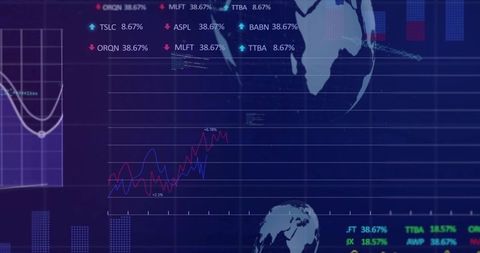
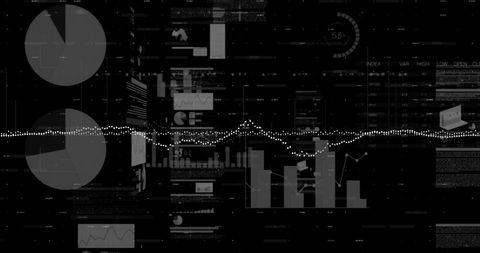
- Futuristic Data Dashboard Displaying Global Analytics and Digital Visualization Interface
Futuristic Data Dashboard Displaying Global Analytics and Digital Visualization Interface Image
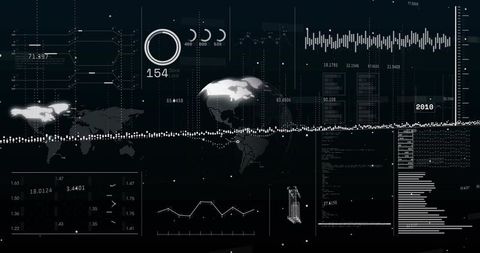
Presenting dark high-contrast data dashboard combining world map overlays, waveform histograms, line charts, and numeric readouts. Design featuring dotted timeline, circular gauges, bar charts, code snippets, and subtle particle effects for futuristic tech feel. Ideal for use in fintech dashboards, cybersecurity control panels, AI analytics presentations, corporate reports, and UI/UX mockups. Working well as header visuals, hero background for websites, slide decks, marketing campaigns, and editorial technology articles. Providing flexible space for overlaying logos, headlines, data callouts, or animated motion graphics. Color palette and contrast supporting monochrome themes while allowing accent color overlays for branding. High-tech ambience communicating innovation, data-driven decision making, and global connectivity.

downloads
Credit Photo
If you would like to credit the Photo, here are some ways you can do so
Free (free of charge)
Free for personal and commercial use.
Author: Awesome Content