- Home >
- Stock Photos >
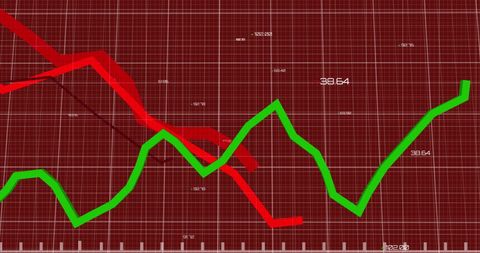
- Futuristic Data Dashboard Showing Dynamic Red Line Graph
Futuristic Data Dashboard Showing Dynamic Red Line Graph Image

Visualization depicts a red line chart with a dynamic and futuristic digital interface. Ideal for illustrating concepts of data analytics, financial fluctuations, or technological advancements. Usage includes corporate presentations, financial reports, and marketing materials focusing on data-driven insights.

downloads
Tags:
More
Credit Photo
If you would like to credit the Photo, here are some ways you can do so
Text Link
photo Link
<span class="text-link">
<span>
<a target="_blank" href=https://pikwizard.com/photo/futuristic-data-dashboard-showing-dynamic-red-line-graph/d199bf5c5c8793f0ae389ab1b4ab3f91/>PikWizard</a>
</span>
</span>
<span class="image-link">
<span
style="margin: 0 0 20px 0; display: inline-block; vertical-align: middle; width: 100%;"
>
<a
target="_blank"
href="https://pikwizard.com/photo/futuristic-data-dashboard-showing-dynamic-red-line-graph/d199bf5c5c8793f0ae389ab1b4ab3f91/"
style="text-decoration: none; font-size: 10px; margin: 0;"
>
<img src="https://pikwizard.com/pw/medium/d199bf5c5c8793f0ae389ab1b4ab3f91.jpg" style="margin: 0; width: 100%;" alt="" />
<p style="font-size: 12px; margin: 0;">PikWizard</p>
</a>
</span>
</span>
Free (free of charge)
Free for personal and commercial use.
Author: Authentic Images