- Home >
- Stock Photos >
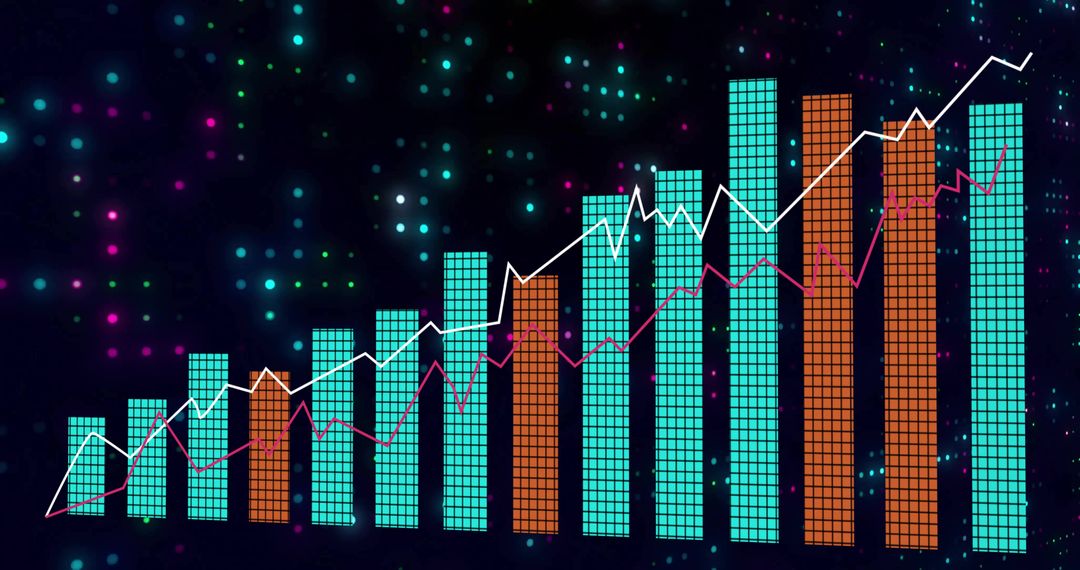
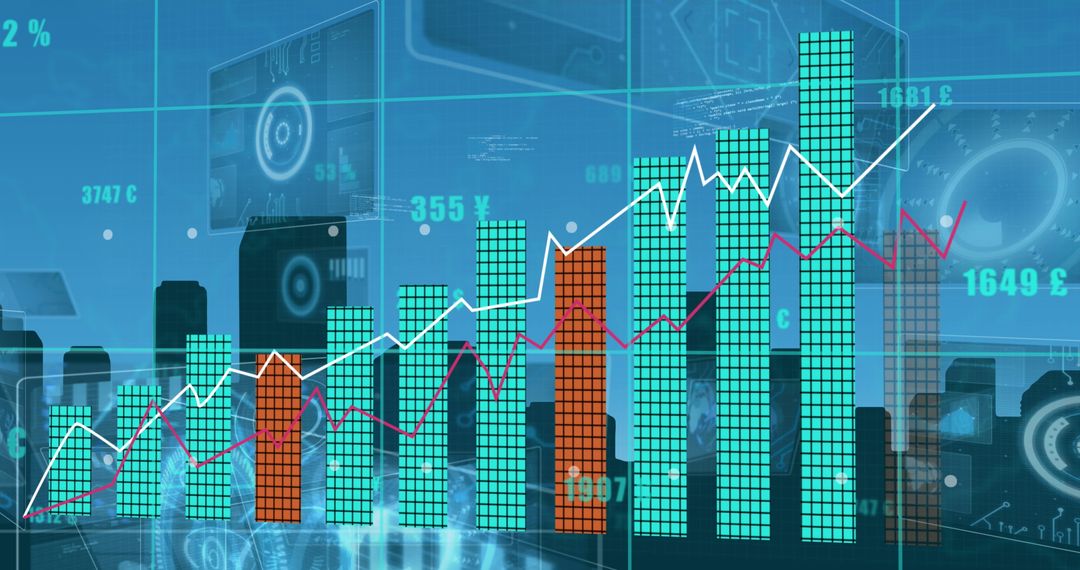
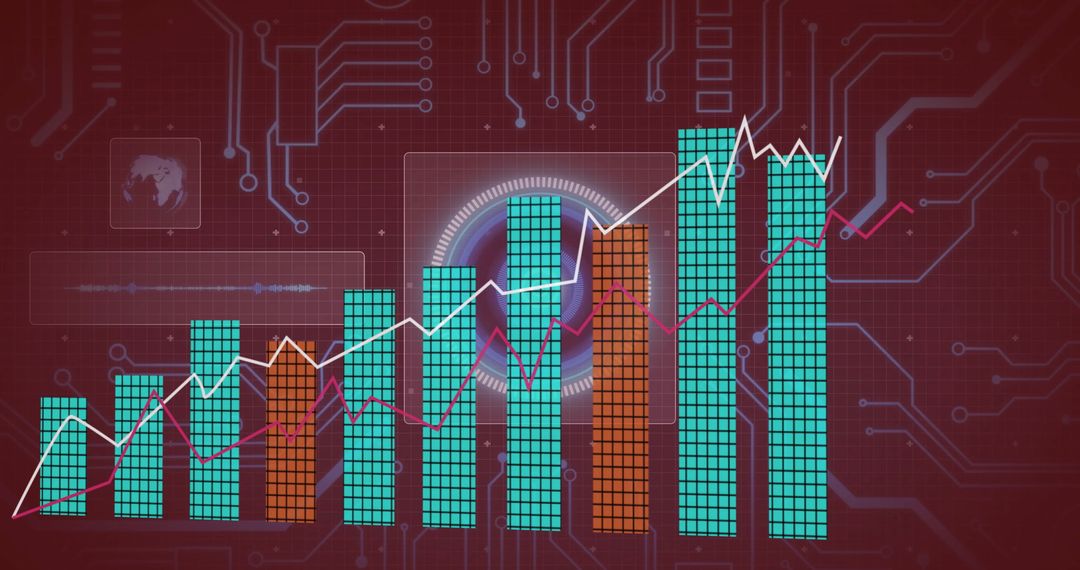
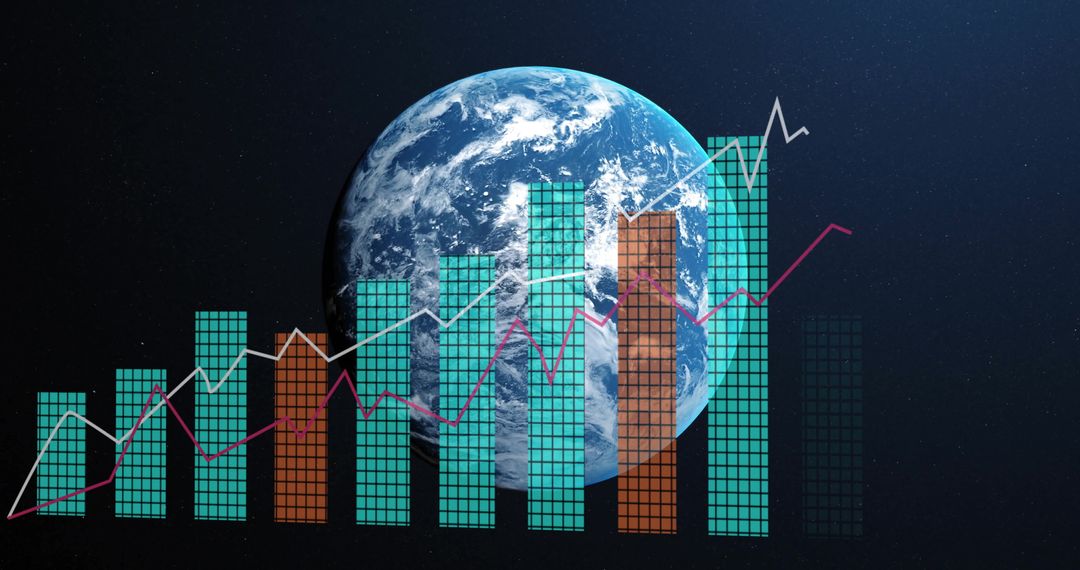
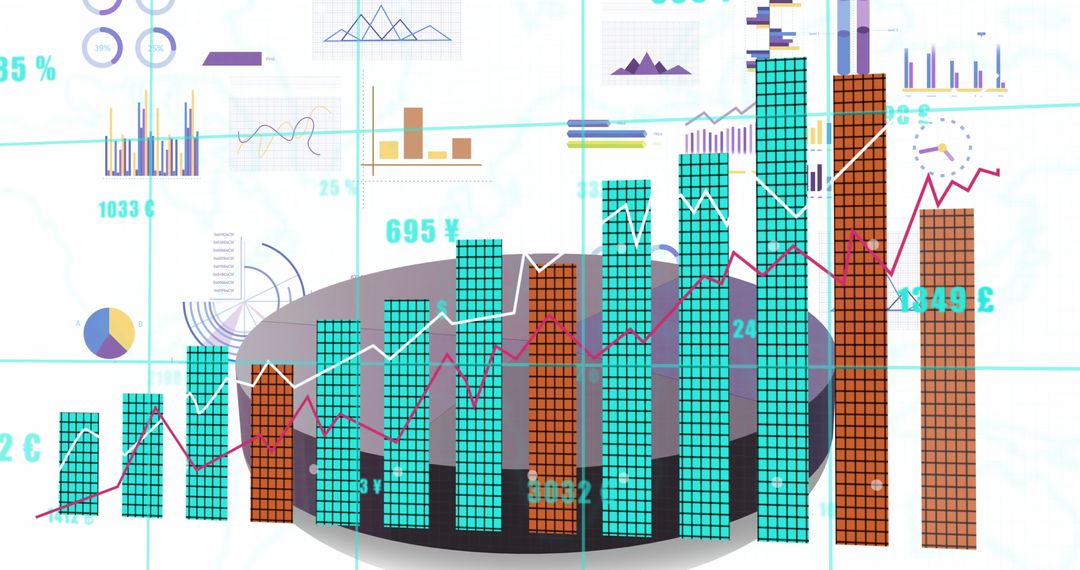
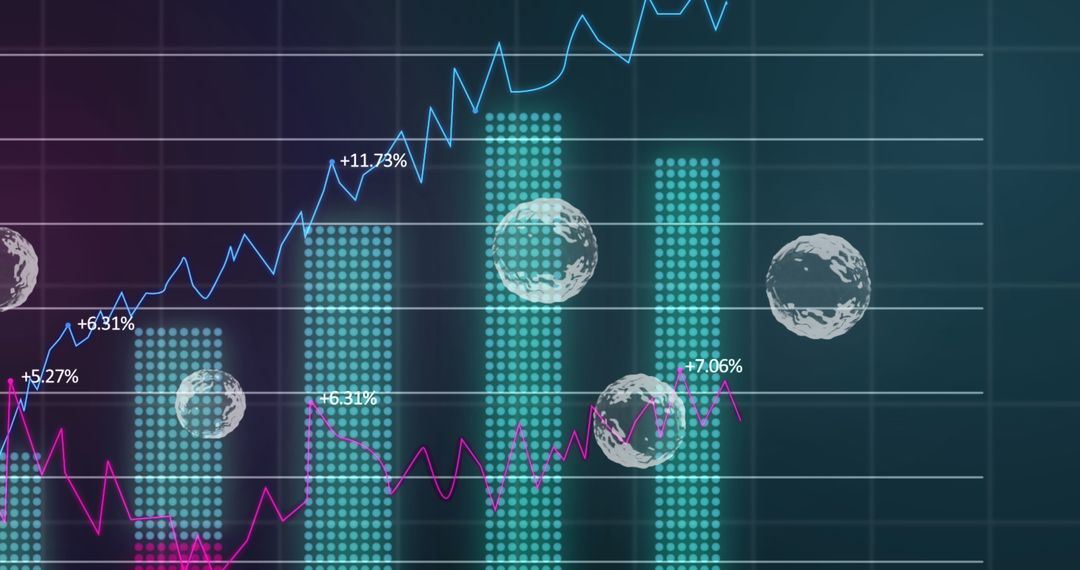
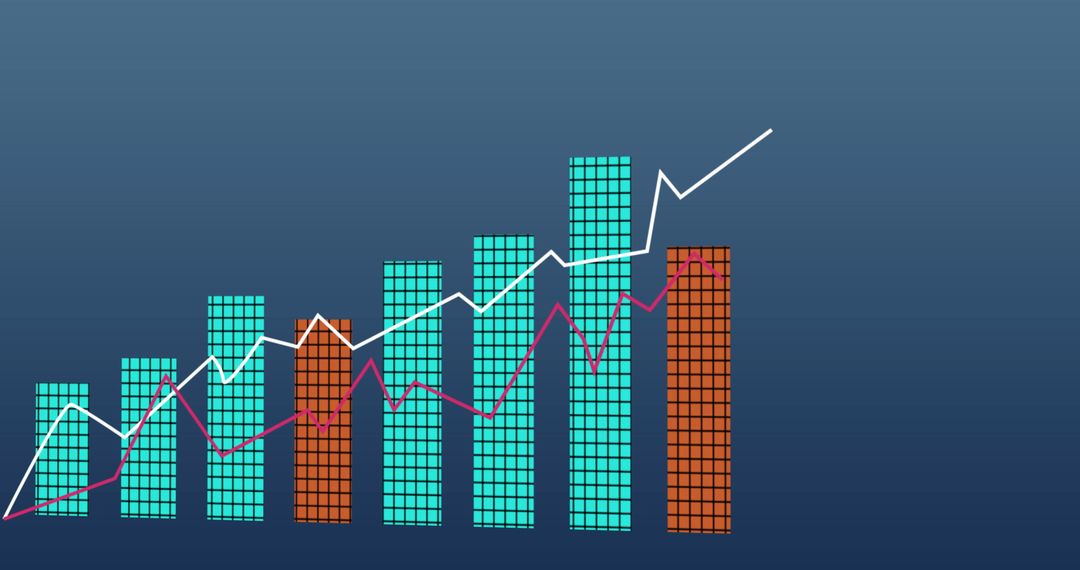
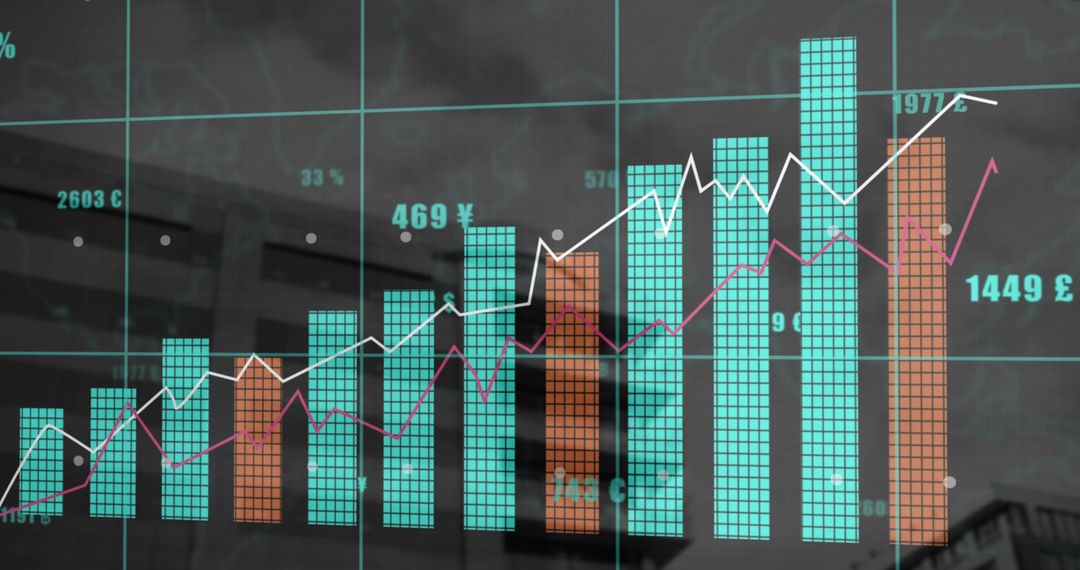
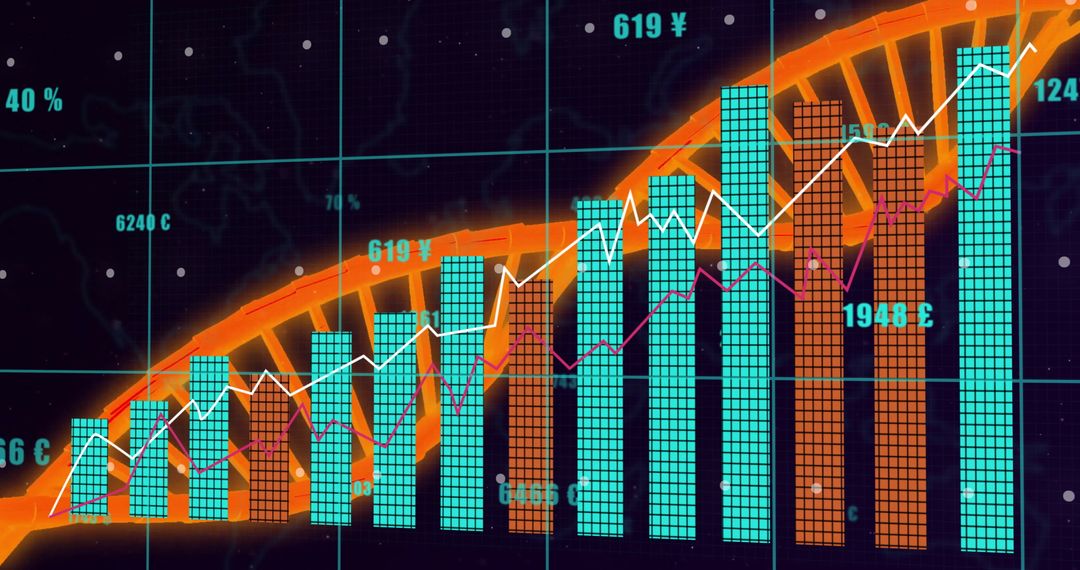
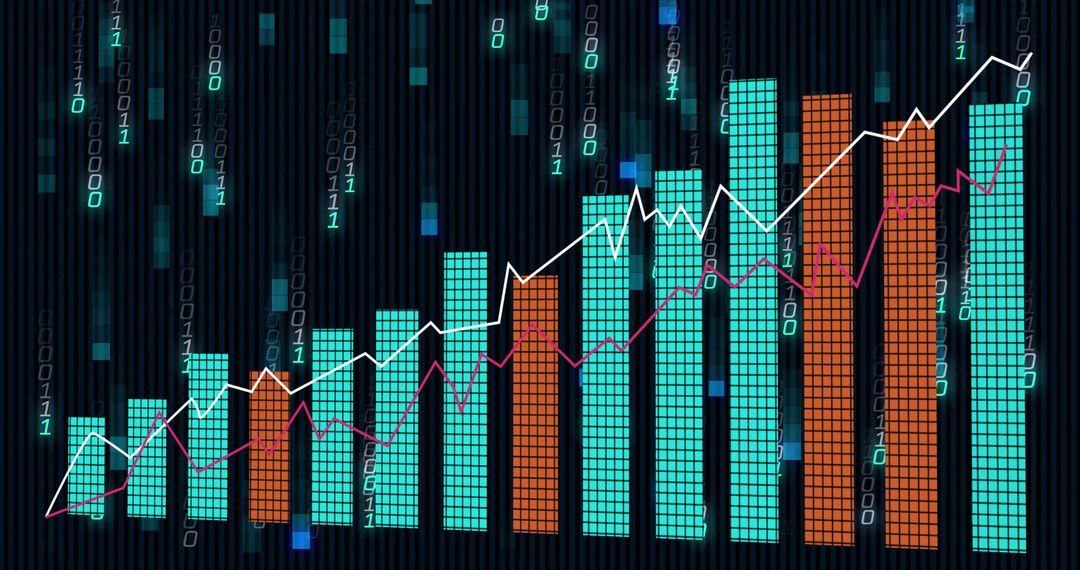
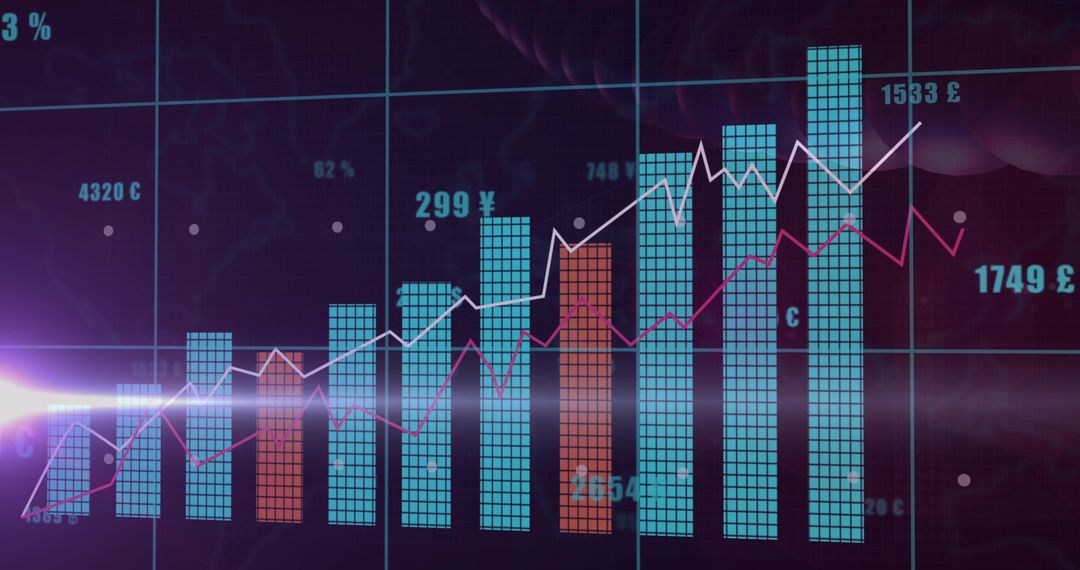
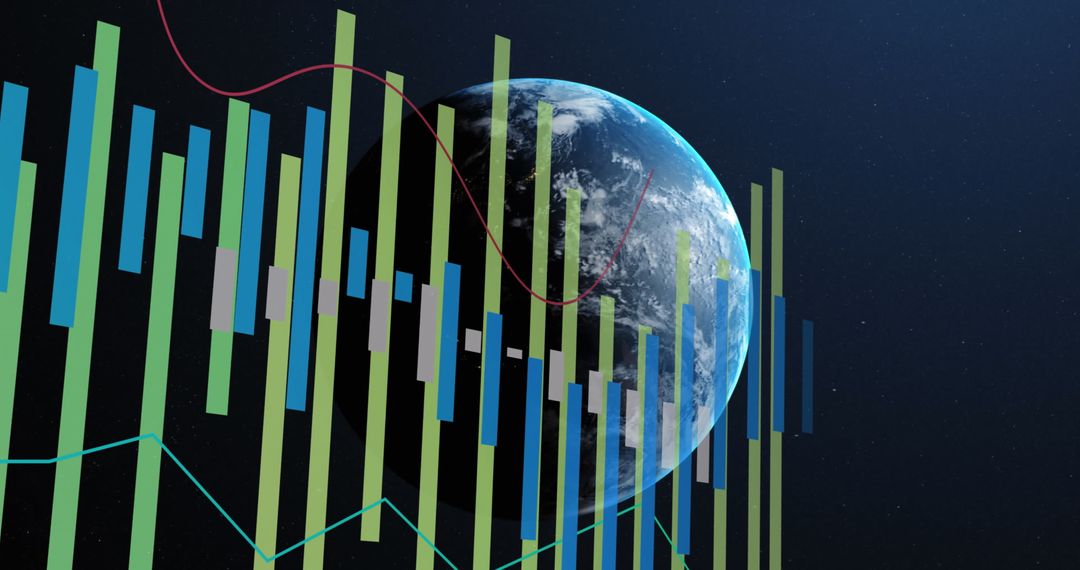
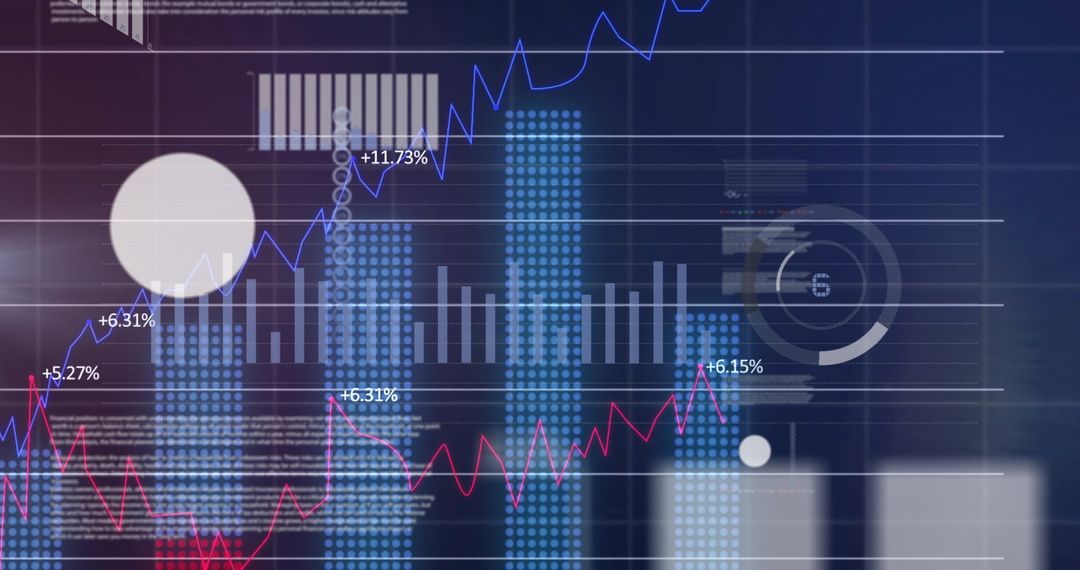
- Futuristic data dashboard showing rising bar chart with neon mosaic bars and trend lines
Futuristic data dashboard showing rising bar chart with neon mosaic bars and trend lines Image
Bright futuristic dashboard showing cyan and orange mosaic bars rising across dark grid background while white and magenta trend lines tracking growth and intersecting at key points. Subtle orb element adding sci-fi depth and visual contrast. Composition suiting technology, finance, analytics, data science, and startup branding. Use cases including hero headers, presentation slides, annual reports, fintech dashboards, social media campaigns, and website banners. Layout allowing overlaying text, KPI numbers, logos, and interactive UI mockups. High-contrast color palette supporting bold branding and editorial design while focusing on performance, trend analysis, and data storytelling.
Powered by  - Get 15% off with code: PIKWIZARD15


0
downloads
downloads
Tags:
More
Credit Photo
If you would like to credit the Photo, here are some ways you can do so
Text Link
photo Link
<span class="text-link">
<span>
<a target="_blank" href=https://pikwizard.com/photo/futuristic-data-dashboard-showing-rising-bar-chart-with-neon-mosaic-bars-and-trend-lines/c0c22588bdad9394ab7914e77bef1274/>PikWizard</a>
</span>
</span>
<span class="image-link">
<span
style="margin: 0 0 20px 0; display: inline-block; vertical-align: middle; width: 100%;"
>
<a
target="_blank"
href="https://pikwizard.com/photo/futuristic-data-dashboard-showing-rising-bar-chart-with-neon-mosaic-bars-and-trend-lines/c0c22588bdad9394ab7914e77bef1274/"
style="text-decoration: none; font-size: 10px; margin: 0;"
>
<img src="https://pikwizard.com/pw/medium/c0c22588bdad9394ab7914e77bef1274.jpg" style="margin: 0; width: 100%;" alt="" />
<p style="font-size: 12px; margin: 0;">PikWizard</p>
</a>
</span>
</span>
Free (free of charge)
Free for personal and commercial use.
Author: Authentic Images
Similar Free Stock Images

Premium


Premium


Premium


Premium


Premium


Premium


Premium


Premium


Premium


Premium


Premium


Premium


Premium


Premium


Premium


Premium


Premium


Premium


Premium


Premium


Premium


Premium


Premium


Premium