
- Home >
- Stock Photos >
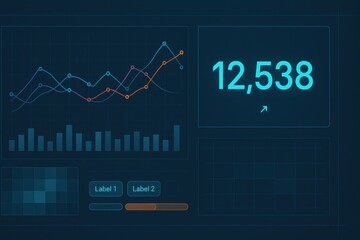
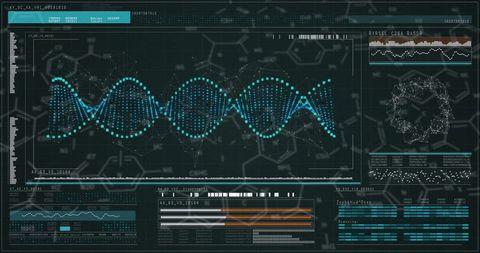
- Futuristic Data Dashboard with Abstract Waveforms and Light Effects
Futuristic Data Dashboard with Abstract Waveforms and Light Effects Image

Abstract visualization showcasing waveforms and light effects on a digital dashboard. Perfect for backgrounds or themes in technology, analytics, and digital interfaces. Ideal for software development presentations, technology blog posts, and educational materials on data science and digital technology.
Powered by 


downloads
Tags:
More
Credit Photo
If you would like to credit the Photo, here are some ways you can do so
Text Link
photo Link
<span class="text-link">
<span>
<a target="_blank" href=https://pikwizard.com/photo/futuristic-data-dashboard-with-abstract-waveforms-and-light-effects/05d3221d44bded57c8b6f66c7e745967/>PikWizard</a>
</span>
</span>
<span class="image-link">
<span
style="margin: 0 0 20px 0; display: inline-block; vertical-align: middle; width: 100%;"
>
<a
target="_blank"
href="https://pikwizard.com/photo/futuristic-data-dashboard-with-abstract-waveforms-and-light-effects/05d3221d44bded57c8b6f66c7e745967/"
style="text-decoration: none; font-size: 10px; margin: 0;"
>
<img src="https://pikwizard.com/pw/medium/05d3221d44bded57c8b6f66c7e745967.jpg" style="margin: 0; width: 100%;" alt="" />
<p style="font-size: 12px; margin: 0;">PikWizard</p>
</a>
</span>
</span>
Free (free of charge)
Free for personal and commercial use.
Author: Authentic Images
Similar Free Stock Images

Premium


Premium

Premium

Premium


Premium


Premium


Premium


Premium


Premium


Premium


Premium

Premium

Premium

Premium


Premium


Premium


Premium

Premium


Premium


Premium

Premium


Premium


Premium


Premium


Premium

Explore More Free Stock Images