- Home >
- Stock Photos >
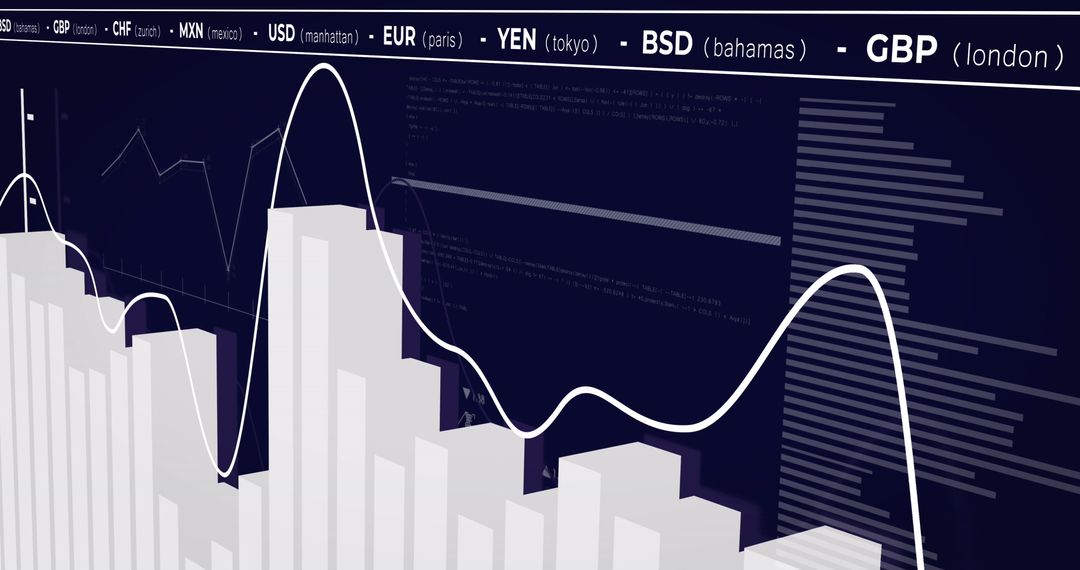
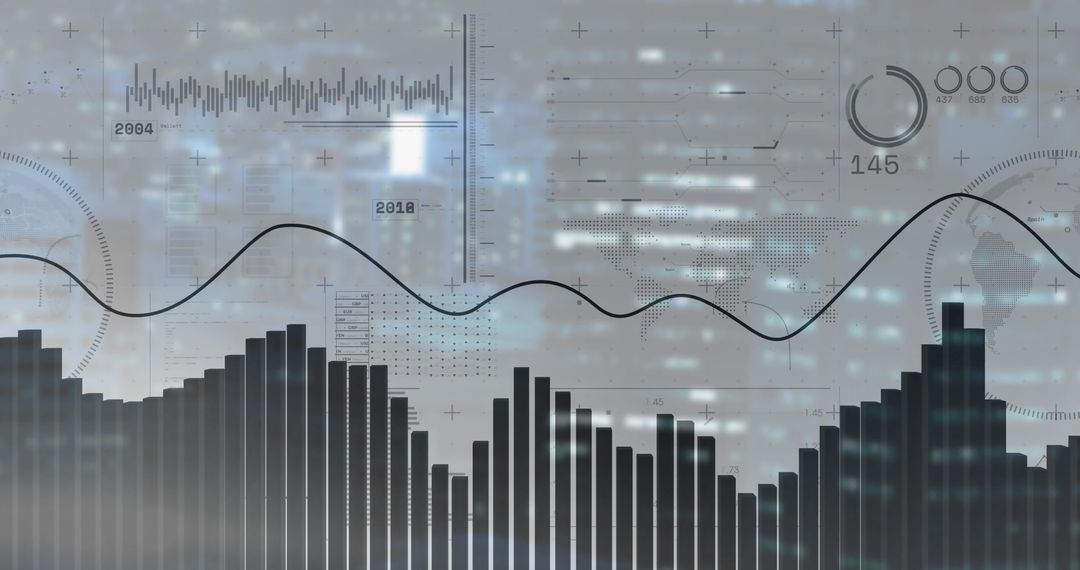
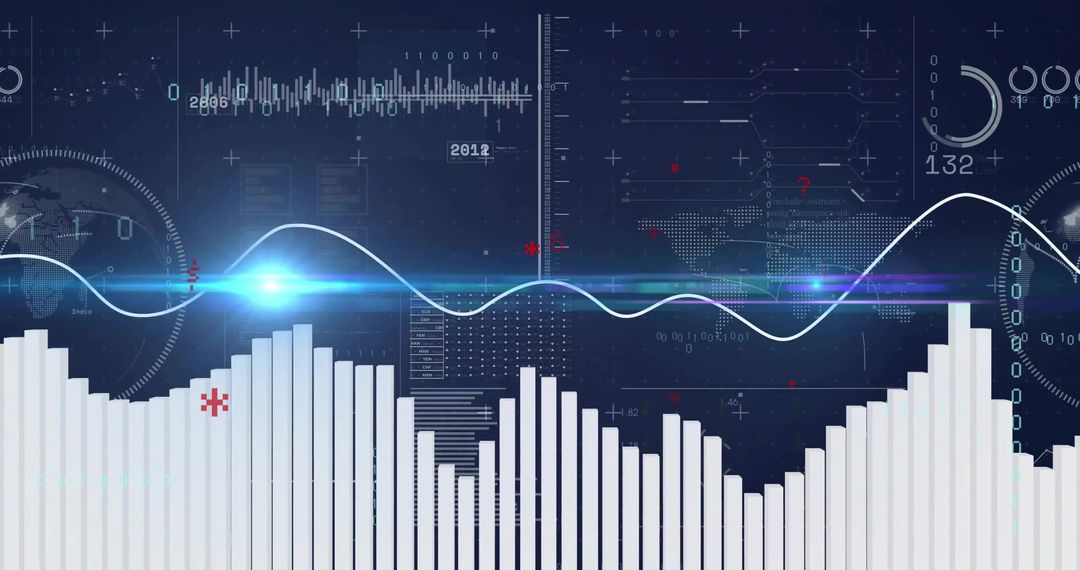
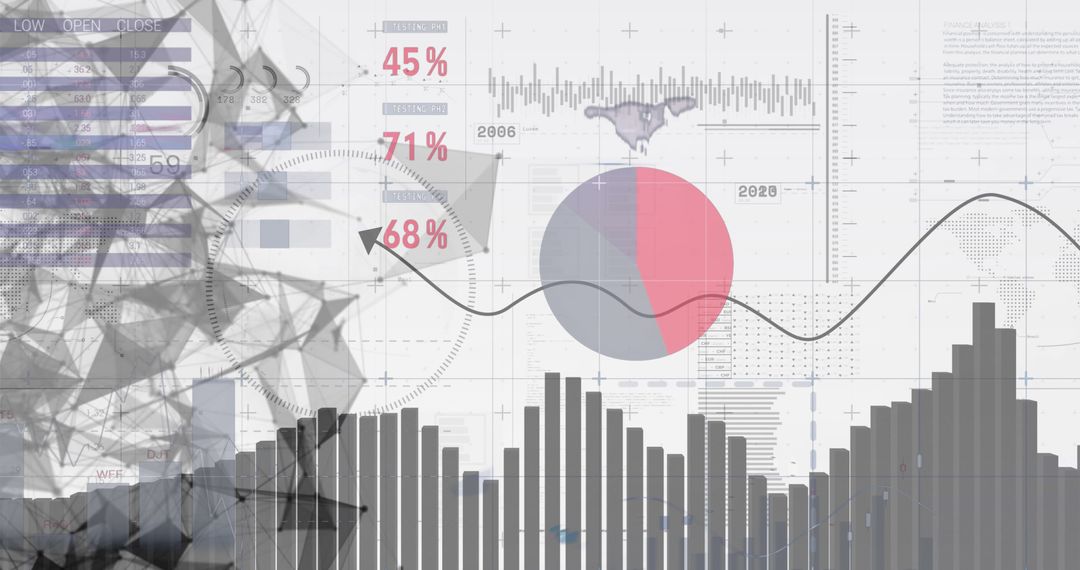
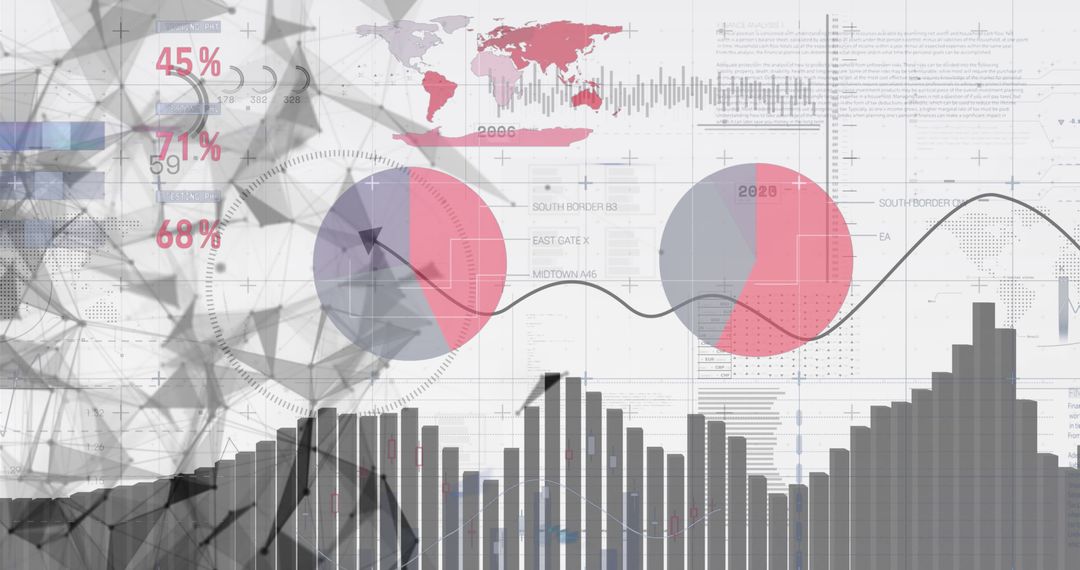
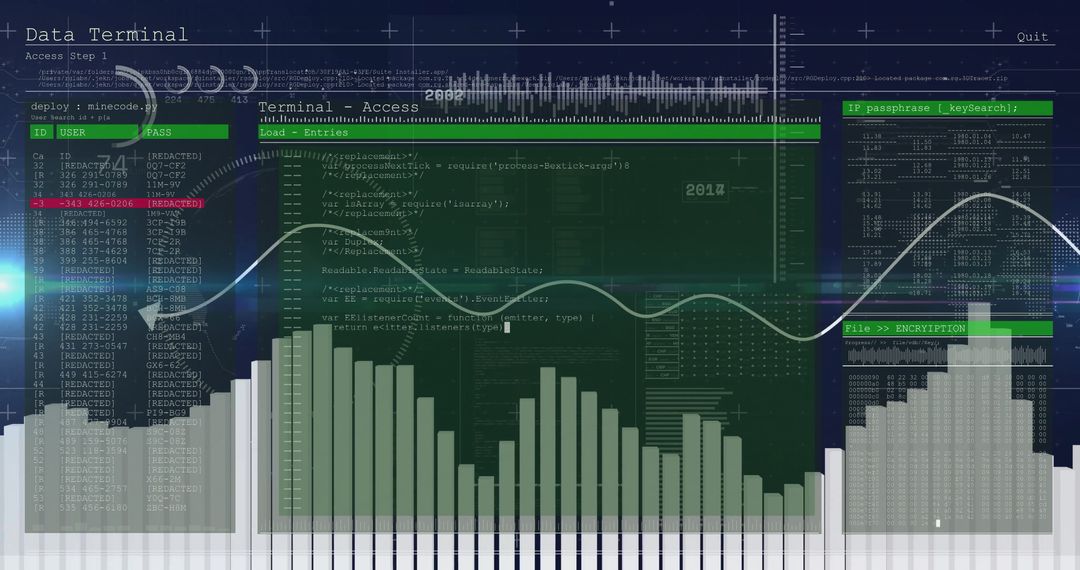
- Futuristic Data Dashboard with Bar Chart, Sine Wave Line, Gauge and Map Overlay
Futuristic Data Dashboard with Bar Chart, Sine Wave Line, Gauge and Map Overlay Image

Displaying translucent HUD elements over blurred night city bokeh, with vertical bar chart, smooth sine wave line, circular gauge and dotted world map. Colorful neon highlights creating futuristic data visualization mood for tech-driven concepts. Suitable for technology, finance, cybersecurity, smart city, IoT, analytics, dashboard, fintech, market research, business intelligence, UI and UX design. Use for website headers, hero banners, presentation slides, annual reports, app mockups, promotional materials, marketing campaigns, social media posts, blog articles. Layering space left for overlaying text, logo or call-to-action. Providing high-tech visual for pitching dashboards, illustrating data trends, demonstrating real-time monitoring and depicting digital transformation.
Powered by 


0
downloads
downloads
Tags:
More
Credit Photo
If you would like to credit the Photo, here are some ways you can do so
Text Link
photo Link
<span class="text-link">
<span>
<a target="_blank" href=https://pikwizard.com/photo/futuristic-data-dashboard-with-bar-chart-sine-wave-line-gauge-and-map-overlay/191bbb10e92067bf1288fa7d70aa6c43/>PikWizard</a>
</span>
</span>
<span class="image-link">
<span
style="margin: 0 0 20px 0; display: inline-block; vertical-align: middle; width: 100%;"
>
<a
target="_blank"
href="https://pikwizard.com/photo/futuristic-data-dashboard-with-bar-chart-sine-wave-line-gauge-and-map-overlay/191bbb10e92067bf1288fa7d70aa6c43/"
style="text-decoration: none; font-size: 10px; margin: 0;"
>
<img src="https://pikwizard.com/pw/medium/191bbb10e92067bf1288fa7d70aa6c43.jpg" style="margin: 0; width: 100%;" alt="" />
<p style="font-size: 12px; margin: 0;">PikWizard</p>
</a>
</span>
</span>
Free (free of charge)
Free for personal and commercial use.
Author: Awesome Content
Similar Free Stock Images

Premium


Premium


Premium


Premium


Premium


Premium


Premium


Premium


Premium


Premium


Premium


Premium


Premium


Premium


Premium


Premium


Premium

Premium


Premium


Premium


Premium


Premium


Premium


Premium