
- Home >
- Stock Photos >
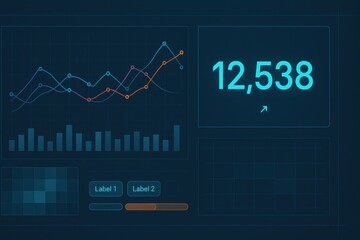
- Futuristic Data Dashboard with Digital Analytics Interface
Futuristic Data Dashboard with Digital Analytics Interface Image

Detailed depiction of a high-tech analytics dashboard presenting digital bar charts and line graphs on a grid. Versatile tool for professionals seeking to illustrate technological themes, data analysis processes, digital trends, or corporate presentations on business analytics.
Powered by 


downloads
Tags:
More
Credit Photo
If you would like to credit the Photo, here are some ways you can do so
Text Link
photo Link
<span class="text-link">
<span>
<a target="_blank" href=https://pikwizard.com/photo/futuristic-data-dashboard-with-digital-analytics-interface/f785f1836f9383741a1610e719bd9163/>PikWizard</a>
</span>
</span>
<span class="image-link">
<span
style="margin: 0 0 20px 0; display: inline-block; vertical-align: middle; width: 100%;"
>
<a
target="_blank"
href="https://pikwizard.com/photo/futuristic-data-dashboard-with-digital-analytics-interface/f785f1836f9383741a1610e719bd9163/"
style="text-decoration: none; font-size: 10px; margin: 0;"
>
<img src="https://pikwizard.com/pw/medium/f785f1836f9383741a1610e719bd9163.jpg" style="margin: 0; width: 100%;" alt="" />
<p style="font-size: 12px; margin: 0;">PikWizard</p>
</a>
</span>
</span>
Free (free of charge)
Free for personal and commercial use.
Author: Awesome Content
Similar Free Stock Images

Premium

Premium


Premium
Premium


Premium


Premium


Premium


Premium


Premium

Premium


Premium


Premium


Premium


Premium

Premium

Premium


Premium


Premium


Premium


Premium


Premium

Premium

Premium


Premium


Premium


Explore More Free Stock Images