- Home >
- Stock Photos >
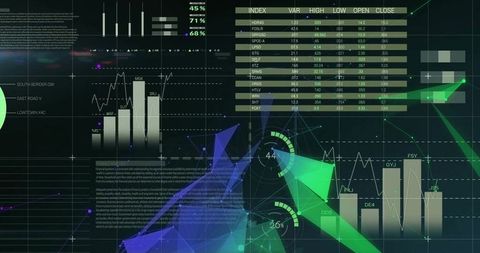
- Futuristic Data Dashboard with Dynamic Analytics and Coding Elements
Futuristic Data Dashboard with Dynamic Analytics and Coding Elements Image

This image features a sophisticated and futuristic data dashboard blending line charts, percentage labels, and coding blocks. It illustrates a high-tech environment, perfect for representing big data analysis, digital transformation, or innovative technological solutions. Ideal for articles, presentations, or websites centered around analytics, software development, tech innovations, or business intelligence.

downloads
Tags:
More
Credit Photo
If you would like to credit the Photo, here are some ways you can do so
Text Link
photo Link
<span class="text-link">
<span>
<a target="_blank" href=https://pikwizard.com/photo/futuristic-data-dashboard-with-dynamic-analytics-and-coding-elements/716fa6d2211a93b0f8a2c525992f01e7/>PikWizard</a>
</span>
</span>
<span class="image-link">
<span
style="margin: 0 0 20px 0; display: inline-block; vertical-align: middle; width: 100%;"
>
<a
target="_blank"
href="https://pikwizard.com/photo/futuristic-data-dashboard-with-dynamic-analytics-and-coding-elements/716fa6d2211a93b0f8a2c525992f01e7/"
style="text-decoration: none; font-size: 10px; margin: 0;"
>
<img src="https://pikwizard.com/pw/medium/716fa6d2211a93b0f8a2c525992f01e7.jpg" style="margin: 0; width: 100%;" alt="" />
<p style="font-size: 12px; margin: 0;">PikWizard</p>
</a>
</span>
</span>
Free (free of charge)
Free for personal and commercial use.
Author: Awesome Content